

Dynamic recognition of the mRNA cap by Saccharomyces cerevisiae eIF4E
- PMID: 24183571
- PMCID: PMC3878992
- DOI: 10.1016/j.str.2013.09.016
Dynamic recognition of the mRNA cap by Saccharomyces cerevisiae eIF4E
Abstract
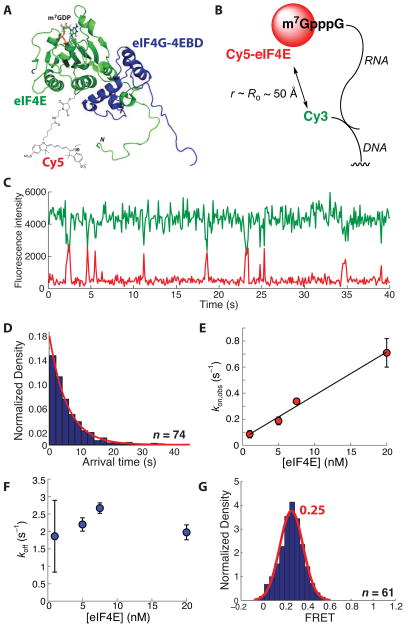
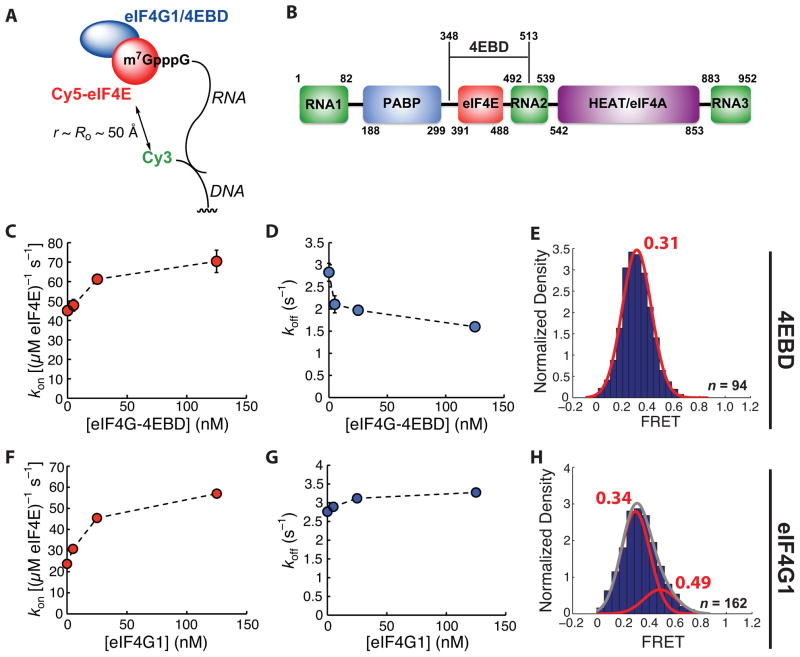
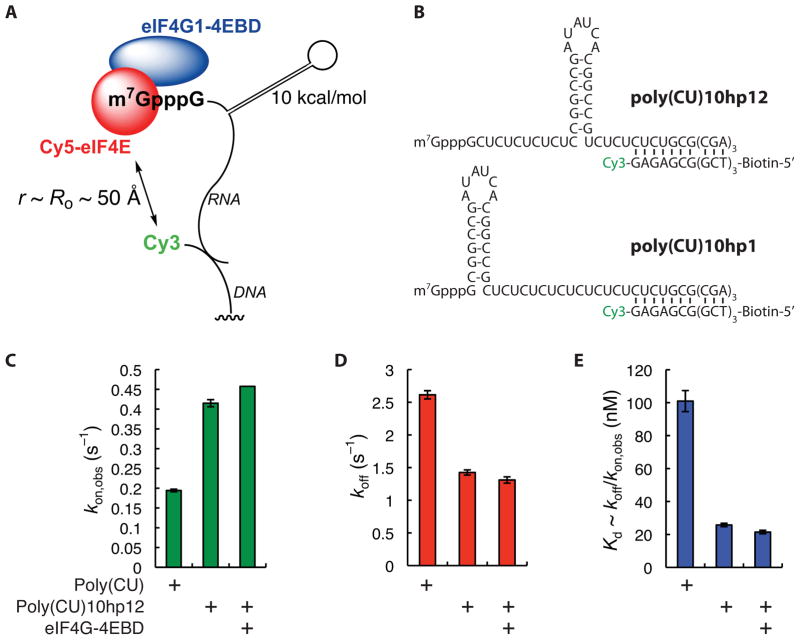
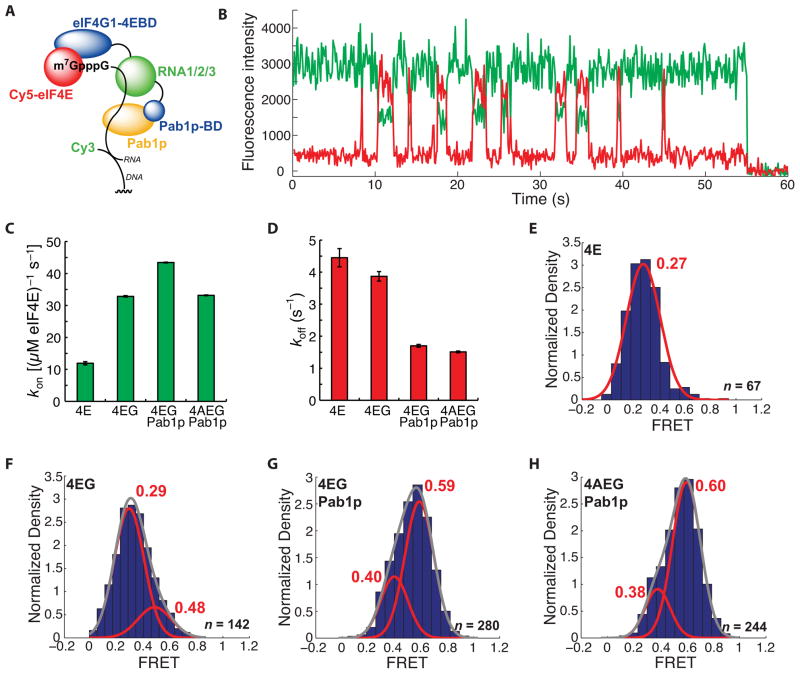
Recognition of the mRNA 5' m⁷G(5')ppp(5')N cap is key to translation initiation for most eukaryotic mRNAs. The cap is bound by the eIF4F complex, consisting of a cap-binding protein (eIF4E), a "scaffold" protein (eIF4G), and an RNA helicase (eIF4A). As a central early step in initiation, regulation of eIF4F is crucial for cellular viability. Although the structure and function of eIF4E have been defined, a dynamic mechanistic picture of its activity at the molecular level in the eIF4F·mRNA complex is still unavailable. Here, using single-molecule fluorescence, we measured the effects of Saccharomyces cerevisiae eIF4F factors, mRNA secondary structure, and the poly(A)-binding protein Pab1p on eIF4E-mRNA binding dynamics. Our data provide an integrated picture of how eIF4G and mRNA structure modulate eIF4E-mRNA interaction, and uncover an eIF4G- and poly(A)-independent activity of poly(A)-binding protein that prolongs the eIF4E·mRNA complex lifetime.
Copyright © 2013 Elsevier Ltd. All rights reserved.
Figures
Similar articles
-
Requirement of RNA binding of mammalian eukaryotic translation initiation factor 4GI (eIF4GI) for efficient interaction of eIF4E with the mRNA cap.Mol Cell Biol. 2009 Mar;29(6):1661-9. doi: 10.1128/MCB.01187-08. Epub 2008 Dec 29. Mol Cell Biol. 2009. PMID: 19114555 Free PMC article.
-
The eukaryotic initiation factor (eIF) 4G HEAT domain promotes translation re-initiation in yeast both dependent on and independent of eIF4A mRNA helicase.J Biol Chem. 2010 Jul 16;285(29):21922-33. doi: 10.1074/jbc.M110.132027. Epub 2010 May 12. J Biol Chem. 2010. PMID: 20463023 Free PMC article.
-
Structural motifs in eIF4G and 4E-BPs modulate their binding to eIF4E to regulate translation initiation in yeast.Nucleic Acids Res. 2018 Jul 27;46(13):6893-6908. doi: 10.1093/nar/gky542. Nucleic Acids Res. 2018. PMID: 30053226 Free PMC article.
-
eIF4G-an integrator of mRNA metabolism?FEMS Yeast Res. 2016 Nov;16(7):fow087. doi: 10.1093/femsyr/fow087. Epub 2016 Sep 29. FEMS Yeast Res. 2016. PMID: 27694156 Review.
-
[Translational control by the poly(A) binding protein: a check for mRNA integrity].Mol Biol (Mosk). 2006 Jul-Aug;40(4):684-93. Mol Biol (Mosk). 2006. PMID: 16913227 Review. Russian.
Cited by
-
The flip-flop configuration of the PABP-dimer leads to switching of the translation function.Nucleic Acids Res. 2022 Jan 11;50(1):306-321. doi: 10.1093/nar/gkab1205. Nucleic Acids Res. 2022. PMID: 34904669 Free PMC article.
-
Dynamics of IRES-mediated translation.Philos Trans R Soc Lond B Biol Sci. 2017 Mar 19;372(1716):20160177. doi: 10.1098/rstb.2016.0177. Philos Trans R Soc Lond B Biol Sci. 2017. PMID: 28138065 Free PMC article. Review.
-
Targeting the translation machinery in cancer.Nat Rev Drug Discov. 2015 Apr;14(4):261-78. doi: 10.1038/nrd4505. Epub 2015 Mar 6. Nat Rev Drug Discov. 2015. PMID: 25743081 Review.
-
Global mRNA selection mechanisms for translation initiation.Genome Biol. 2015 Jan 5;16(1):10. doi: 10.1186/s13059-014-0559-z. Genome Biol. 2015. PMID: 25650959 Free PMC article.
-
eIF5B gates the transition from translation initiation to elongation.Nature. 2019 Sep;573(7775):605-608. doi: 10.1038/s41586-019-1561-0. Epub 2019 Sep 18. Nature. 2019. PMID: 31534220 Free PMC article.
References
-
- Aitken CE, Lorsch JR. A mechanistic overview of translation initiation in eukaryotes. Nat Struct Mol Biol. 2012;19:568–576. - PubMed
-
- Altmann M, Trachsel H. The yeast Saccharomyces cerevisiae system: a powerful tool to study the mechanism of protein synthesis initiation in eukaryotes. Biochimie. 1994;76:853–861. - PubMed
MeSH terms
Substances
Grants and funding
LinkOut - more resources
Full Text Sources
Other Literature Sources
Molecular Biology Databases
Research Materials
Miscellaneous
