. 2013 Dec;123(12):5284-97.
doi: 10.1172/JCI70877. Epub 2013 Nov 1.

Enhanced autophagy ameliorates cardiac proteinopathy

Enhanced autophagy ameliorates cardiac proteinopathy

Md Shenuarin Bhuiyan et al. J Clin Invest. 2013 Dec.

Abstract

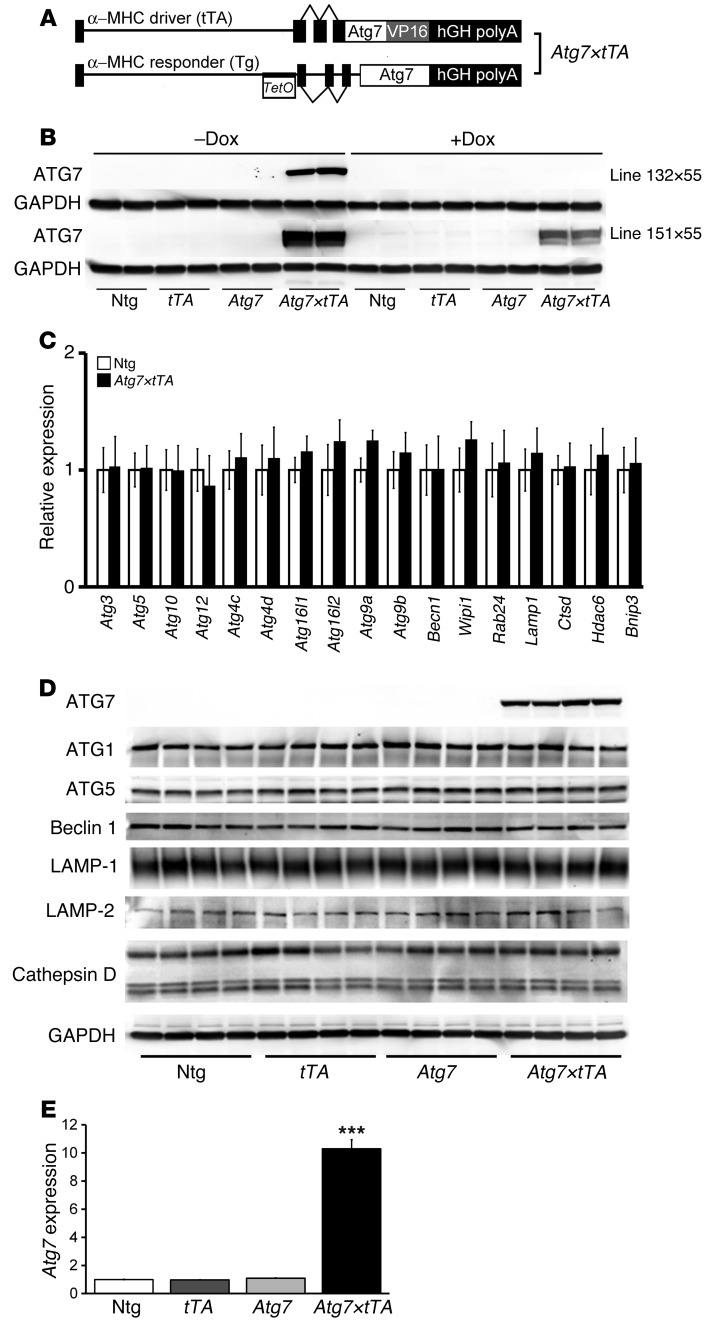
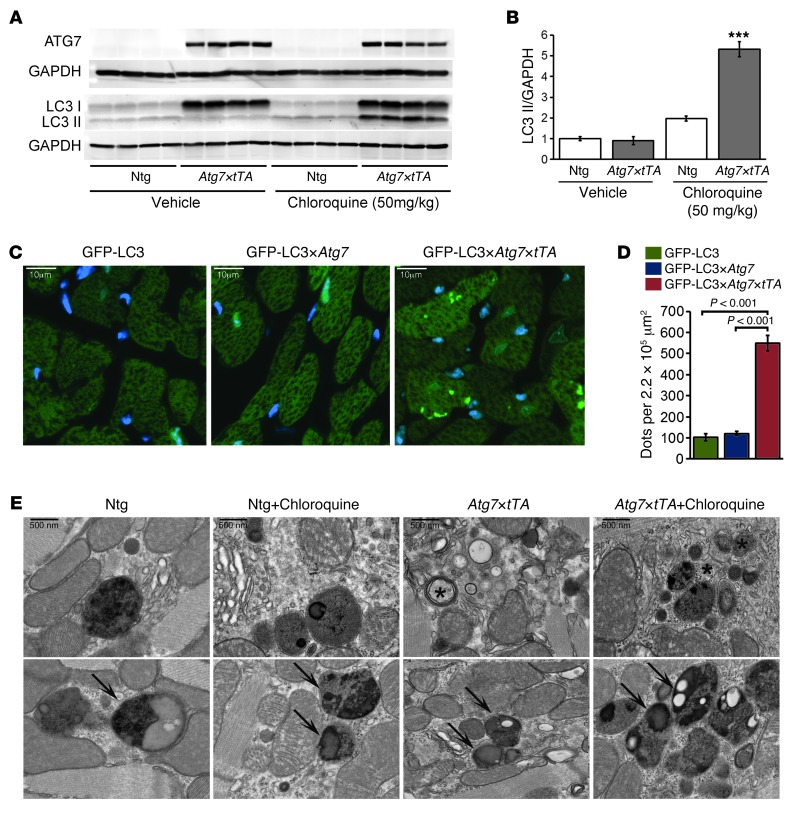
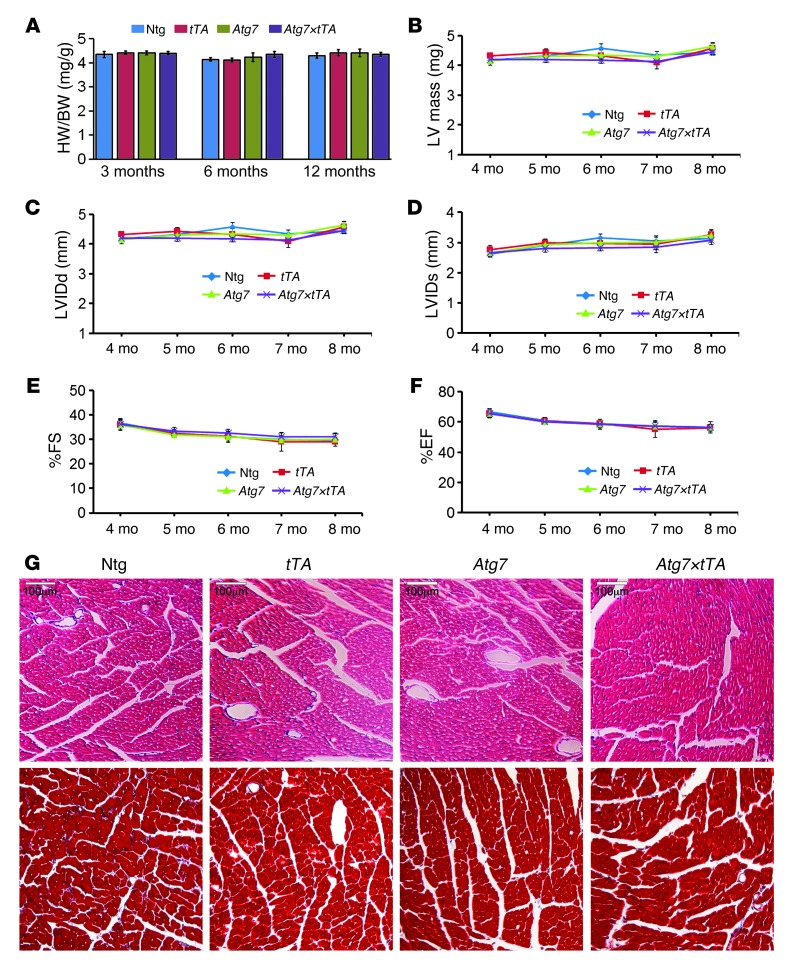
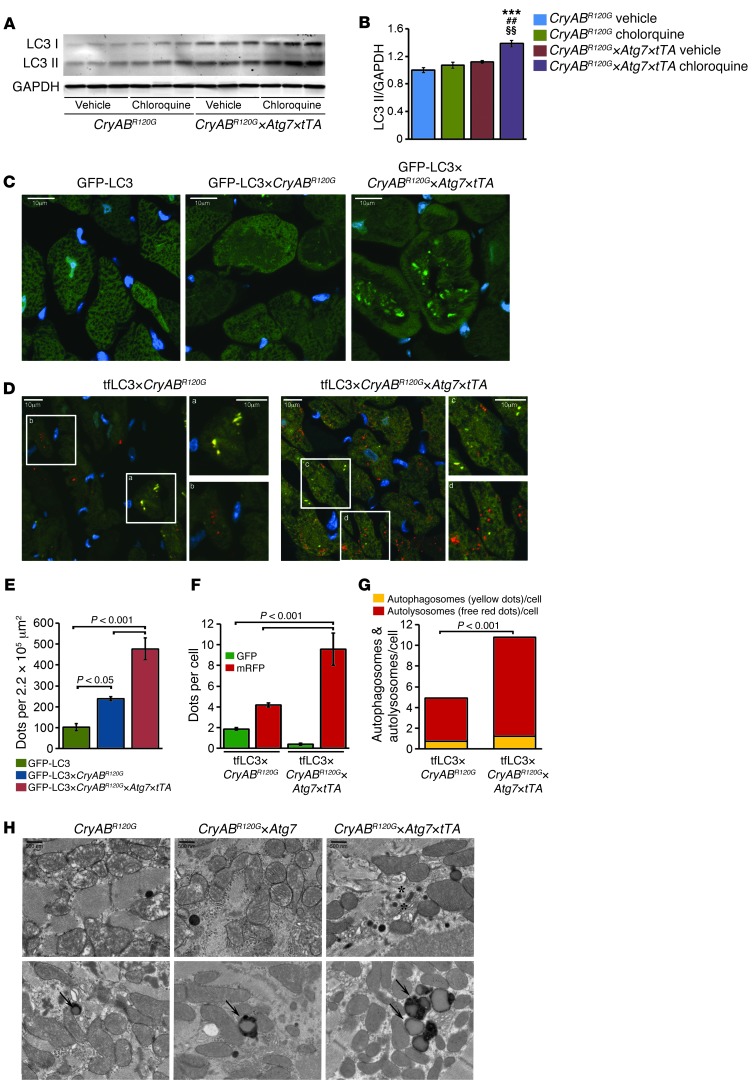
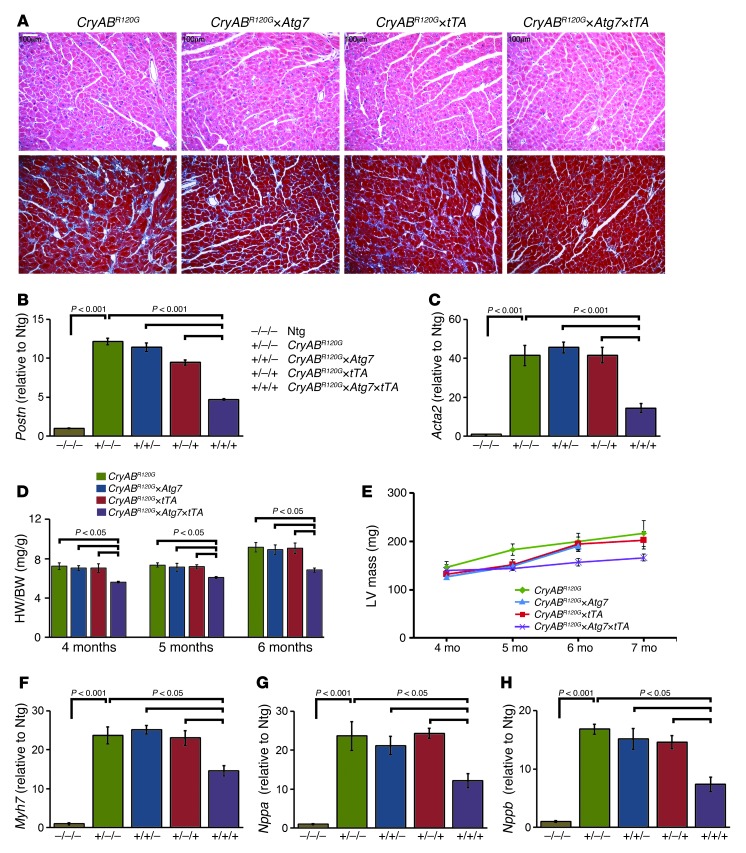
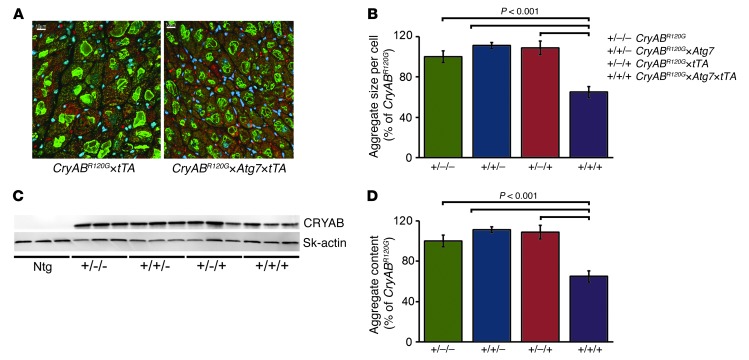
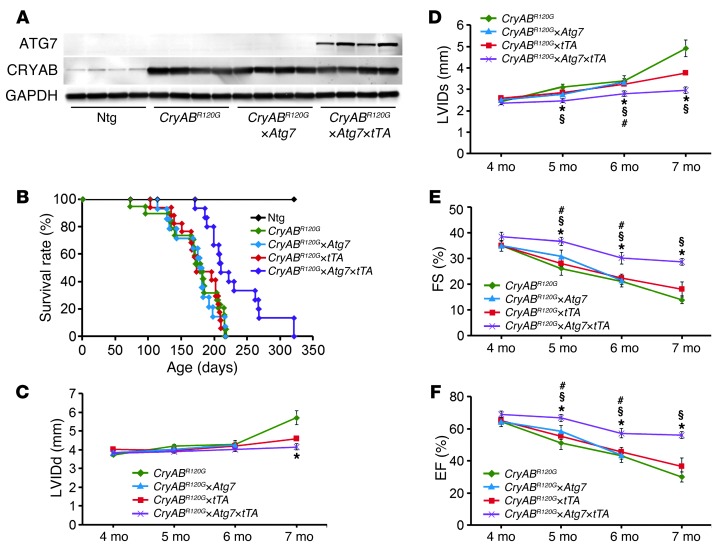
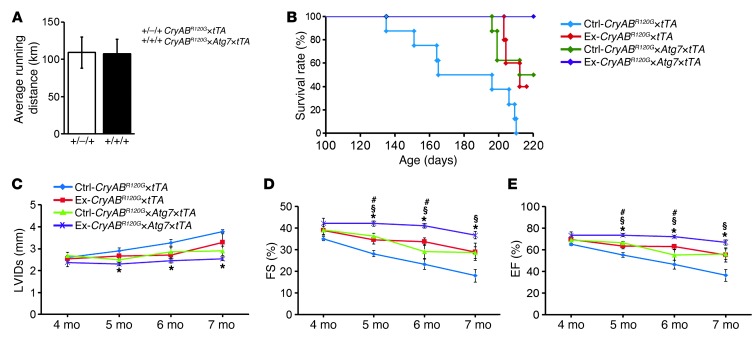
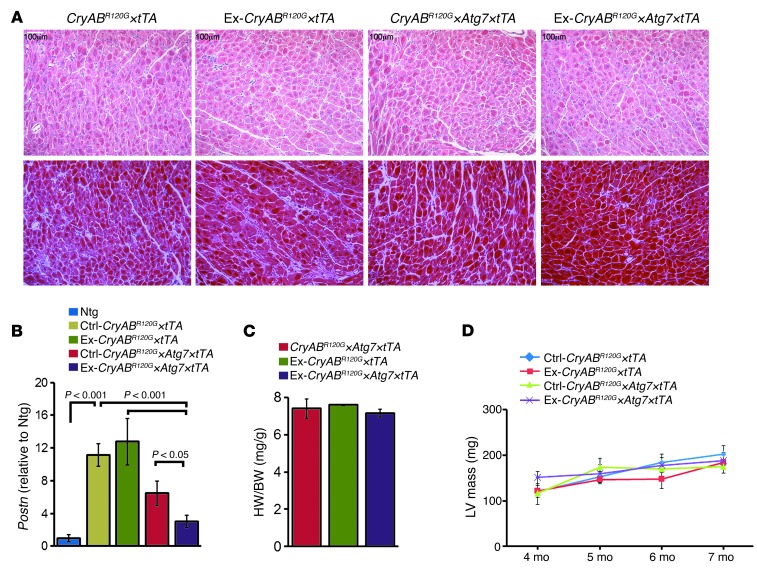
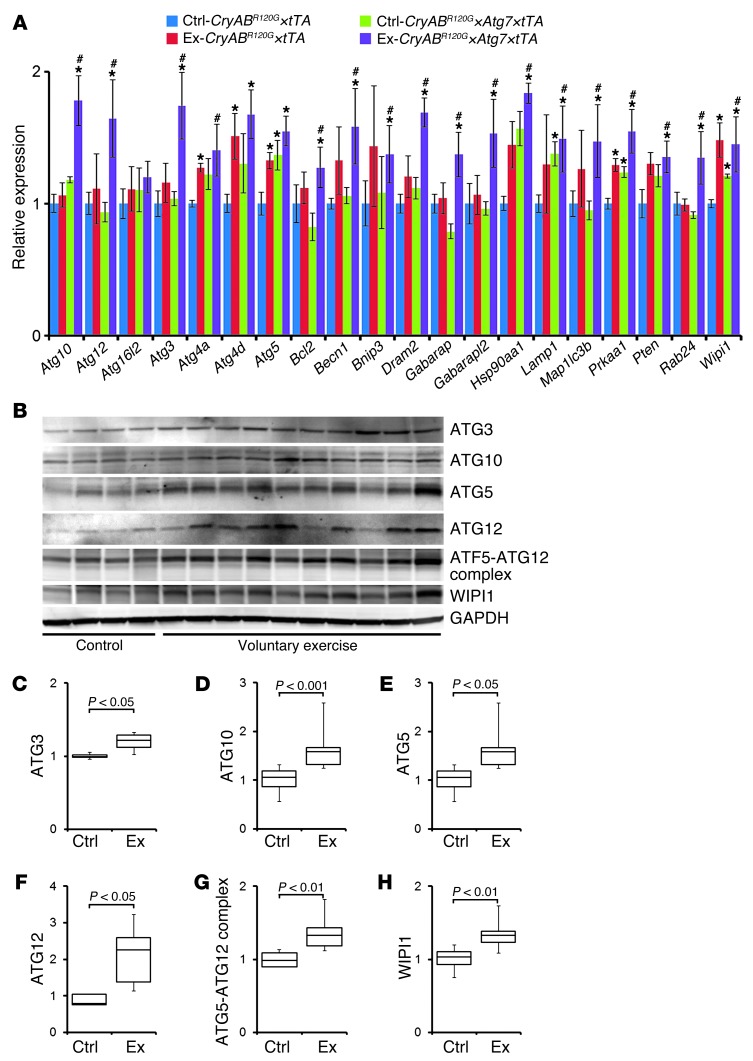
Basal autophagy is a crucial mechanism in cellular homeostasis, underlying both normal cellular recycling and the clearance of damaged or misfolded proteins, organelles and aggregates. We showed here that enhanced levels of autophagy induced by either autophagic gene overexpression or voluntary exercise ameliorated desmin-related cardiomyopathy (DRC). To increase levels of basal autophagy, we generated an inducible Tg mouse expressing autophagy-related 7 (Atg7), a critical and rate-limiting autophagy protein. Hearts from these mice had enhanced autophagy, but normal morphology and function. We crossed these mice with CryABR120G mice, a model of DRC in which autophagy is significantly attenuated in the heart, to test the functional significance of autophagy activation in a proteotoxic model of heart failure. Sustained Atg7-induced autophagy in the CryABR120G hearts decreased interstitial fibrosis, ameliorated ventricular dysfunction, decreased cardiac hypertrophy, reduced intracellular aggregates and prolonged survival. To determine whether different methods of autophagy upregulation have additive or even synergistic benefits, we subjected the autophagy-deficient CryABR120G mice and the Atg7-crossed CryABR120G mice to voluntary exercise, which also upregulates autophagy. The entire exercised Atg7-crossed CryABR120G cohort survived to 7 months. These findings suggest that activating autophagy may be a viable therapeutic strategy for improving cardiac performance under proteotoxic conditions.


Figures

Figure 1
Figure 1. Generation and characterization of cardiomyocyte-specific inducible Atg7-overexpressing mice (Atg7×tTA).
(A) Construct design of the binary Tg system regulated by Dox to inducibly overexpress Atg7 in the heart. (B) Representative Western blot showing ATG7 cardiac protein from 2 lines (line 132 and line 151) of 3-month-old Ntg, tTA-Tg, Atg7-Tg, and Atg7×tTA mice without or with Dox (17). (C) Autophagy-related transcript analyses in Atg7×tTA hearts. Shown is a direct groupwise comparison of fold change in mRNA levels in male Atg7×tTA and Ntg hearts at 5 months (n = 3 per group). (D) Western blot showing ATG7 expression and expression levels of autophagy-related proteins in the hearts of 3-month-old Ntg, tTA-Tg, Atg7-Tg, and Atg7×tTA (line 132×55) mice. (E) Quantitation of Atg7 expression for line 132. ***P < 0.001 versus all other groups, Tukey’s post-hoc test.
Figure 2
Figure 2. Autophagy in Atg7×tTA mouse hearts.
(A) Autophagic flux assay (see Methods) showed increased LC3-II levels by Western blot analysis in Ntg and Atg7×tTA hearts (n = 4 per treatment). (B) Densitometry analysis of LC3-II expression relative to GAPDH. ***P < 0.001 vs. Ntg, Tukey’s post-hoc test. (C) Representative images of GFP-LC3 puncta (autophagosomes) in hearts from male GFP-LC3 control, GFP-LC3×Atg7, and GFP-LC3×Atg7×tTA mice. (D) Quantification of GFP puncta per microscopic field (220,000 μm2) in LV. (E) Ultrastructural analyses confirmed an increase in autophagic structures in Atg7×tTA hearts. Arrows denote amphisomes; asterisks denote multilamellar bodies. Scale bars: 10 μm (C); 500 nm (E).
Figure 3
Figure 3. Cardiac function and histology of Atg7×tTA mouse hearts.
(A) HW/BW ratios at 3, 6, and 12 months in Ntg, tTA-Tg, Atg7-Tg, and Atg7×tTA mice (n ≥ 6 per group). (B) Serial changes in LV mass index by echocardiography across genotypes, indicative of normal heart size. (CF) Effect of Atg7 overexpression on echocardiography indices of LV end-diastolic diameter, measured by (C) LVIDd and (D) LVIDs, and LV function, measured by (E) %FS and (F) %EF (n ≥ 10 per group). (G) H&E (top) and Masson’s trichrome (bottom) staining of cardiac histological sections from 6-month-old mice showed no differences or overt pathology with Atg7 overexpression. Scale bars: 100 μm.
Figure 4
Figure 4. Autophagy flux analysis in CryABR120G×Atg7×tTA mouse hearts.
(A) Autophagic flux assay showed increased LC3-II levels in CryABR120G×Atg7 hearts (n = 3 per treatment). (B) Densitometry analysis showed increased LC3-II relative to GAPDH in CryABR120G×Atg7 hearts. ***P < 0.001 vs. vehicle-treated CryABR120G; ##P < 0.001 vs. chloroquine-treated CryABR120G; §§P < 0.01 vs. vehicle-treated CryABR120G×Atg7×tTA, Tukey’s post-hoc test. (C) Representative images of GFP-LC3 puncta (autophagosomes) in hearts from male GFP-LC3 control, GFP-LC3×CryABR120G, and GFP-LC3×CryABR120G×Atg7×tTA mouse hearts. Immunofluorescence analysis of heart sections showing punctate LC3 staining in 4-month-old mice. DAPI (blue) was used to identify nuclei. Original magnification, ×60. (D) Representative images of autophagosomes (yellow puncta) (mRFP-GFP-LC3) and their maturation into autolysosomes (red puncta) in hearts from male tf-LC3×CryABR120G and tf-LC3×CryABR120G×Atg7×tTA mice. Boxed regions are shown enlarged at right. (E) Quantification of GFP puncta per microscopic field (220,000 μm2) in LV. (F) Mean numbers of GFP green and mRFP red puncta per cell. (G) Mean numbers of autophagosomes and autolysosomes (represented by yellow and red puncta, respectively, in D) per cell. (H) Representative TEM of CryABR120G, CryABR120G×Atg7, and CryABR120G×Atg7×tTA hearts showing increased membranous structures (asterisks) and autophagosomes (arrows) in CryABR120G×Atg7×tTA hearts. Scale bars: 10 μm (C and D); 500 nm (H).
Figure 5
Figure 5. Histology and morphometry of CryABR120G×Atg7×tTA mouse hearts.
(A) H&E (top) and Masson’s trichrome (bottom) staining of cardiac sections from 4-month-old CryABR120G, CryABR120G×Atg7, CryABR120G×tTA, and CryABR120G×Atg7×tTA mice (n ≥ 6 per group). (B and C) mRNA expression of Postn (B) and Acta2 (C). Values are expressed as fold change versus Ntg (n = 3 per group). (D) HW/BW ratio at 4, 5, and 6 months of age. (E) Serial changes in LV mass index by echocardiography across genotypes (n ≥ 10 mice per group). (FH) mRNA expression of Myh7 (F), Nppa (G), and Nppb (H). Values are expressed as fold change versus Ntg control (n = 6 per group). P values were determined by Tukey’s post-hoc test. Scale bars: 100 μm.
Figure 6
Figure 6. Overexpression of Atg7 significantly reduced misfolded protein accumulation in CryABR120G hearts.
(A) Immunofluorescence staining for CRYAB (green) with troponin I counterstaining (red) showed decreased aggregate levels in CryABR120G×Atg7×tTA cardiomyocytes. (B) Quantification of CryAB aggregates showed decreased aggregate accumulation in CryABR120G×Atg7×tTA mice. (C) Representative Western blot showing aggregated CRYAB protein levels present in the insoluble fractions. (D) Densitometry analysis showed decreased aggregate in the insoluble protein fraction in CryABR120G×Atg7×tTA mice (n = 6 per group). P values were determined by Tukey’s post-hoc test. Scale bars: 10 μm.
Figure 7
Figure 7. Cardiac hemodynamics in CryABR120G×Atg7×tTA mice.
(A) Western blot showing ATG7 and CRYAB expression in Ntg, CryABR120G, CryABR120G×Atg7, and CryABR120G×Atg7×tTA mice. (B) Kaplan-Meier curves of CryABR120G (n = 20), CryABR120G×tTA (n = 17), CryABR120G×Atg7 (n = 14), and CryABR120G×Atg7×tTA (n = 15) mice. (CF) Echocardiography indices of LV end-diastolic diameter, measured by (C) LVIDd and (D) LVIDs, and LV function, measured by (E) %FS and (F) %EF (n ≥ 10 mice per group). *P < 0.05 vs. CryABR120G; #P < 0.05 vs. CryABR120G×tTA; §P < 0.05 vs. CryABR120G×Atg7, Tukey’s post-hoc test.
Figure 8
Figure 8. Effect of voluntary exercise on CryABR120G×Atg7×tTA mice.
(A) Average running distance traveled by mice subjected to voluntary exercise for 7 months. (B) Kaplan-Meier survival curves of CryABR120G×tTA (n = 8) and CryABR120G×Atg7×tTA (n = 9) mice. (CE) Echocardiography indices of (C) LV end-diastolic diameter, measured by LVIDs function, and LV function, measured by (D) %FS and (E) %EF, in male nonexercised and exercised mice (n = 8 per group). *P < 0.05 vs. nonexercised CryABR120G×tTA; #P < 0.05 vs. exercised CryABR120G×tTA; §P < 0.05 vs. nonexercised CryABR120G×Atg7×tTA, Tukey’s post-hoc test.
Figure 9
Figure 9. Histology and morphometry of exercised CryABR120G×Atg7×tTA mouse hearts.
(A) H&E (top) and Masson’s trichrome (bottom) staining of cardiac sections from 7-month-old nonexercised and exercised CryABR120G×tTA and CryABR120G×Atg7×tTA mice. (B) Postn mRNA levels, expressed as fold change relative to Ntg (n = 3 per group). (C) HW/BW ratios at 7 months of age (n ≥ 6 per group). (D) Serial changes in LV mass index by echocardiography across genotypes (n = 8 per group). P values were determined by Tukey’s post-hoc test. Scale bars: 100 μm.
Figure 10
Figure 10. Autophagy response in exercised CryABR120G×Atg7×tTA mouse hearts.
(A) Autophagy PCR array. Direct groupwise comparisons of mRNA levels in male exercised and nonexercised CryABR120G×Atg7×tTA and CryABR120G×tTA hearts at 5 months of age, expressed as fold change versus nonexercised CryABR120G×tTA (n = 3 per group). *P < 0.05 vs. nonexercised CryABR120G×tTA; #P < 0.05 vs. nonexercised CryABR120G×Atg7×tTA, 2-tailed Student’s t test. (BH) Western blot demonstrating protein level changes of some of the upregulated genes identified by PCR array in CryABR120G×Atg7×tTA hearts. The obtained PCR array results were validated by Western blot (B). Densitometry analysis showed upregulation of autophagy-related proteins ATG3 (C), ATG10 (D), ATG5 (E), ATG12 (F), ATG5-ATG12 complex (G), and WIPI1 (H) in exercised (n = 10 per group) versus nonexercised (n = 4 per group) CryABR120G×Atg7×tTA hearts. Boxes represent interquartile ranges; lines represent medians; whiskers represent ranges. P values were determined by Tukey’s post-hoc test.

Similar articles

Cited by

References

    1. Mizushima N, Levine B, Cuervo AM, Klionsky DJ. Autophagy fights disease through cellular self-digestion. Nature. 2008;451(7182):1069–1075. doi: 10.1038/nature06639. - DOI - PMC - PubMed
    1. Levine B, Kroemer G. Autophagy in the pathogenesis of disease. Cell. 2008;132(1):27–42. doi: 10.1016/j.cell.2007.12.018. - DOI - PMC - PubMed
    1. Rubinsztein DC. The roles of intracellular protein-degradation pathways in neurodegeneration. Nature. 2006;443(7113):780–786. doi: 10.1038/nature05291. - DOI - PubMed
    1. Kirkin V, McEwan DG, Novak I, Dikic I. A role for ubiquitin in selective autophagy. Mol Cell. 2009;34(3):259–269. doi: 10.1016/j.molcel.2009.04.026. - DOI - PubMed
    1. Komatsu M, et al. Impairment of starvation-induced and constitutive autophagy in Atg7-deficient mice. J Cell Biol. 2005;169(3):425–434. doi: 10.1083/jcb.200412022. - DOI - PMC - PubMed

Publication types

MeSH terms

Supplementary concepts