. 2013 Nov 1;27(21):2380-96.
doi: 10.1101/gad.229328.113. Epub 2013 Oct 21.

Ubiquitously transcribed genes use alternative polyadenylation to achieve tissue-specific expression

Affiliations

Ubiquitously transcribed genes use alternative polyadenylation to achieve tissue-specific expression

Steve Lianoglou et al. Genes Dev. .

Abstract

More than half of human genes use alternative cleavage and polyadenylation (ApA) to generate mRNA transcripts that differ in the lengths of their 3' untranslated regions (UTRs), thus altering the post-transcriptional fate of the message and likely the protein output. The extent of 3' UTR variation across tissues and the functional role of ApA remain poorly understood. We developed a sequencing method called 3'-seq to quantitatively map the 3' ends of the transcriptome of diverse human tissues and isogenic transformation systems. We found that cell type-specific gene expression is accomplished by two complementary programs. Tissue-restricted genes tend to have single 3' UTRs, whereas a majority of ubiquitously transcribed genes generate multiple 3' UTRs. During transformation and differentiation, single-UTR genes change their mRNA abundance levels, while multi-UTR genes mostly change 3' UTR isoform ratios to achieve tissue specificity. However, both regulation programs target genes that function in the same pathways and processes that characterize the new cell type. Instead of finding global shifts in 3' UTR length during transformation and differentiation, we identify tissue-specific groups of multi-UTR genes that change their 3' UTR ratios; these changes in 3' UTR length are largely independent from changes in mRNA abundance. Finally, tissue-specific usage of ApA sites appears to be a mechanism for changing the landscape targetable by ubiquitously expressed microRNAs.

Keywords: 3′ UTR isoform; alternative polyadenylation; computational biology; gene regulation; tissue-specific regulation of gene expression; transcriptome analysis.


Figures

Figure 1.
Figure 1.
3′-Seq generates a quantitative transcriptome-wide atlas of pA cleavage events. (A) 3′-Seq protocol. Total RNA was reverse-transcribed with an oligo(dT) primer extended at the 5′ end by a sequencing adapter bound to magnetic beads. The oligo(dT) primer contained a uridine. After second strand synthesis, a nick was introduced at the uridine, and nick translation was used to shift the nick ∼50–75 nt away from the 3′ end. At the new position of the nick, a blunt end was created, and the second sequencing adapter was ligated. After ∼10 cycles of PCR and gel purification, the library was sequenced. (B) Atlas of pA cleavage events. mRNA transcript abundance across human tissues and cell lines is shown; for example, genes with one, two, three, or five 3′ UTR isoforms. The peaks report the abundance of each isoform in transcripts per million (TPM). The gene model is drawn to scale and shows the terminal exon. (C) 3′-Seq is reproducible at the level of mRNA abundance. mRNA levels of biological replicate samples are shown in TPM. TPM is calculated using all reads that map to the 3′ UTR of a given gene. (D) 3′-Seq is reproducible at the level of 3′ UTR isoform abundance. The UTR index (UI) of replicate samples is shown. The UI reflects the fraction of reads mapping to a given pA site out of all of the reads mapping to the 3′ UTR. (E) Correlation of the UI as measured by 3′-seq and Northern blot analyses of 136 genes.
Figure 2.
Figure 2.
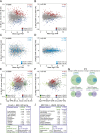
Transformation results in alterations of mRNA levels and in changes of 3′ UTR length in different groups of genes that function in the same biological processes. (A) Difference in the relative abundance of 3′ UTR isoforms of naïve B cells before and after transformation with EBV. The plot shows the difference in the UI between two samples (the UI in B-LCLs minus the UI in naïve B cells; Y-axis) as a function of mRNA abundance (mean log2 TPM of B-LCLs and naïve B cells; X-axis) for all jointly expressed multi-UTR genes. The statistically significant ApA events based on GLM analysis (FDR-adjusted P < 0.1) are shown in color. (B) Difference in the relative abundance of 3′ UTR isoforms of MCF10A cells before and after transformation with HRAS (MCF10A + HRAS, MCF10AR). The plot axes are similar to those in A. (C) Plot as in A, but the statistically significant ApA events from B, which are expressed in B cells and B-LCLs, are shown in blue. (D) Plot as in B, but the statistically significant ApA events from A, which are expressed in MCF10A and MCF10AR, are shown in blue. (E) Changes in mRNA levels versus changes in ApA isoform abundance in naïve B cells before and after EBV transformation. The plot shows the fold change in mRNA levels (X-axis) versus the difference in the relative abundance of 3′ UTR isoforms (Y-axis). Genes that significantly change their mRNA levels and genes that significantly change their 3′ UTR isoform levels are color-coded. The genes that change both mRNA levels and 3′ UTR length are depicted in black. (F) As in E but for MCF10A before and after HRAS transformation. (G, top) Venn diagram showing genes that change mRNA abundance during EBV transformation (FDR-adjusted P < 0.05). Single-UTR genes are enriched among the genes that change mRNA abundance (Fisher's exact test, P < 10−16). (Bottom) Venn diagram showing the overlap of multi-UTR genes that change their mRNA abundance and those that change their 3′ UTR isoform expression. (H) As in G but for HRAS transformation. Single-UTR genes are enriched among the genes that change mRNA abundance (Fisher's exact test, P < 10−16). (I) GO analysis for genes that change mRNA levels and genes that change 3′ UTR isoform levels in naïve B cells before and after EBV transformation. P-values were obtained after background correction using the union of all genes expressed in either B-LCLs or naïve B cells. The most significant GO categories are shown. All significant GO terms are listed in Supplemental Table 3. (J) As in I but for MCF10A before and after HRAS transformation. The most significant GO categories are shown. All significant GO terms are listed in Supplemental Table 4.
Figure 3.
Figure 3.
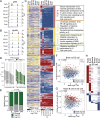
ApA isoform levels in ubiquitously transcribed genes are tissue-specific and independent of mRNA levels. (A) An example of a pAM gene is shown (TRAPPC3). Details as in Figure 1B. (B) An example of an NpAM gene is shown (SUPT4H1). Details as in Figure 1B. (C, left panel) mRNA levels. Shown is the quantile-normalized mRNA abundance in TPM for all jointly expressed pAM genes (n = 1958). Each row corresponds to a gene, and each column corresponds to a tissue sample. mRNA levels are color-coded (see the legend), with yellow corresponding to high TPM levels and purple corresponding to low TPM levels. The ordering of the rows is described in the middle panel. (Middle panel) UI across tissues. Shown is the UI for all the genes from the left panel in the same order. The UI is color-coded (see the legend), with red corresponding to a high UI (high fraction of the short isoform) and blue corresponding to a low UI (high fraction of the long isoform). The color-coded bar to the right of the heat map indicates the tissue that shows an increased fraction of shorter or longer 3′ UTR isoforms. The color used for each tissue corresponds to the indicated tissues in the right panel. (Right panel) Significantly enriched GO terms for genes that generate a higher fraction of the shorter 3′ UTR isoforms in a specific tissue. All significant GO terms are listed in Supplemental Table 5. (D) The distribution of the UI in each tissue is independent of a change in mRNA levels across all seven tissues. A change in mRNA abundance was recorded if the range in mRNA levels across the seven tissue samples was log2TPM ≥ 2.5. Genes were split into two groups (those with a change in mRNA abundance [n = 1853–2196] and those without a change in mRNA abundance [n = 825–990]), and the distribution of the UI for each group was plotted. A Mann-Whitney test was performed comparing the two groups for each tissue separately, and in each case, the distributions were not significantly different (P > 0.1). The distribution is shown using box plots. (Horizontal line) Median; (box) 25th through 75th percentile; error bars indicate range. The tissue samples are indicated with letters. (T) testis; (Bc) B cells; (S) skeletal muscle; (ES) ES cells; (Br) breast; (O) ovary; (Bn) brain. (E) In genes with single 3′ UTRs, a significantly higher fraction of genes shows a change in mRNA levels [range of log2 TPM ≥ 2.5 across seven tissues] than in multi-UTR genes (Mann-Whitney test, P < 10−9). NpAM and pAM genes show a comparable fraction of genes that change their mRNA levels across the seven tissues (Mann-Whitney test, P < 0.08). (F) Difference in abundance of 3′ UTR isoforms between the brain and ES cells. The plot shows the difference in the UI of two samples (the UI in the brain minus UI in ES cells; Y-axis) as a function of mRNA abundance (mean log2 TPM of brain and ES cells; X-axis) for all jointly expressed genes. The statistically significant ApA events (FDR-adjusted P < 0.1) are color-coded. (G) Difference in the abundance of 3′ UTR isoforms between naïve B cells and ES cells. The plot is as described in F. (H) Heat map showing the significantly different ApA events (FDR-adjusted P < 0.1) between six differentiated tissues and ES cells. Shown are all jointly expressed genes. Each row corresponds to a gene. (Red) Higher fraction of the shorter 3′ UTR isoform observed in the differentiated tissue; (blue) higher fraction of the longer 3′ UTR isoform observed in the differentiated tissue; (white) no significant difference in 3′ UTR isoform levels between ES cells and a given differentiated tissue.
Figure 4.
Figure 4.
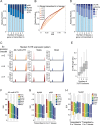
Ubiquitously transcribed genes are enriched in multi-UTR genes and show significantly less usage of their proximal pA sites than tissue-restricted genes. (A) Fraction of single, NpAM, or pAM genes stratified by the number of tissues in which a gene is transcribed. (B) Cumulative distribution of the SUI of all multi-UTR genes stratified by the number of tissues in which a gene is transcribed. The distribution of the SUI between ubiquitous and tissue-restricted genes is significantly different (Kolmogorov-Smirnoff [KS] test, P < 10−16). (C) Illustration of the median 3′ UTR isoform expression pattern of multi-UTR genes that generate two isoforms stratified by the number of tissues in which a gene is transcribed (expression breadth). (Left panel) Median UI for all multi-UTR genes transcribed in two, four, or seven tissue samples. (Middle panel) Median UI for the same genes in the testis. (Right panel) Median UI for the same genes in the brain. Only values for the most proximal and distal pA sites are shown. A gene model depicting the terminal exon is shown below. (D) Fraction of genes with one, two, three, or more than three 3′ UTR isoforms stratified by the number of tissues in which a gene is transcribed. (E) Distribution of 3′ UTR length stratified by the number of 3′ UTR isoforms observed for a gene. Box plots were plotted as in Figure 3D. (F) Distribution of the SUI of all multi-UTR genes expressed in a given tissue. Box plots were plotted as in Figure 3D. (G) Distribution of the SUI of ubiquitously expressed NpAM and pAM genes. pAM genes were identified using an FDR-adjusted P < 0.1, whereas the shown NpAM genes have an FDR-adjusted P > 0.6. (H) Distribution of the SUI of tissue-restricted and ubiquitously expressed NpAM genes. NpAM genes were identified using an FDR-adjusted P > 0.6. The significance of the difference in the SUI distributions has P-values that range between P = 0.002 and P = 10−9 (Mann-Whitney test), depending on the tissue. Box plots were plotted as in Figure 3D.
Figure 5.
Figure 5.
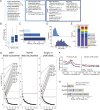
pAM genes are regulated at the post-transcriptional level by miRNAs as well as through differential ApA site usage. (A) Enriched GO terms in ubiquitously transcribed single-UTR, NpAM, and pAM genes. All significant GO terms are listed in Supplemental Tables 6–8. (B) 3′ UTR length in ubiquitously transcribed single-UTR, NpAM, and pAM genes. Box plots were plotted as in Figure 3D. (C) Median 3′ UTR length in single-UTR, NpAM, and pAM genes. The horizontal bars show the median distance from the stop codon to the distal pA sites. The red line depicts the median distance from the stop codon to the proximal pA sites. (D) Range of the SUI at a given pA site across the seven tissue samples in NpAM and pAM genes. (E) Relative frequency of the pA hexamer sequence in ubiquitously transcribed single-UTR, NpAM, and pAM genes at the proximal (or only) pA sites. (F) Conservation score in the 400 nt surrounding the proximal pA site in ubiquitously transcribed NpAM and pAM genes. pAM genes with an increased fraction of the shorter 3′ UTR isoform in a single tissue (TS short; Fig. 3C, top half) are shown separately (red). As a control, the conservation score at a random position within the 3′ UTR is shown. Conservation was calculated using phastCons tracks from 46 vertebrates (see the Supplemental Material). (G, left panel) Enrichment of conserved miRNA-binding sites for ubiquitously transcribed genes in the distal compared with the proximal part of the 3′ UTR of pAM genes. Each black dot shows the negative log P-value for the enrichment statistic for a miRNA (binomial test) (see the Supplemental Material). All broadly conserved miRNA seed families as well as miRNAs that are expressed in the seven tissues are included in the analysis (92 miRNAs total) (Supplemental Table 9). As a control, the same enrichment statistics are shown for conserved seed matches for 10,000 randomly generated miRNA seeds with the same nucleotide composition as the true miRNAs (gray dots). miRNAs are ordered along the X-axis by decreasing significance of enrichment. The dotted lines show the cutoff using an FDR = 0.1 or FDR = 0.25 (bold) relative to the empirical null model (see the Supplemental Material). (Middle panel) As in the left panel but enrichment of conserved miRNA-binding sites for ubiquitously transcribed NpAM genes comparing the distal and the proximal part of the 3′ UTR. In this comparison, none of the miRNAs was significantly enriched at an FDR-corrected empirical P-value threshold of P < 0.25. Therefore, we placed a single horizontal line above the top-ranked miRNA to indicate that all of the miRNAs fall below the 0.25 FDR threshold. (Right panel) As in left panel but enrichment of conserved miRNA-binding sites for ubiquitously transcribed genes with single 3′ UTRs compared with the distal part of the 3′ UTR of pAM genes. (H) Model for different modes of the tissue-specific miRNA/target interaction in single-UTR and multi-UTR genes (see the text). Features are as in C.

Similar articles

Cited by

References

    1. Akman BH, Can T, Erson-Bensan AE 2012. Estrogen-induced upregulation and 3′-UTR shortening of CDC6. Nucleic Acids Res 40: 10679–10688 - PMC - PubMed
    1. An JJ, Gharami K, Liao GY, Woo NH, Lau AG, Vanevski F, Torre ER, Jones KR, Feng Y, Lu B, et al. 2008. Distinct role of long 3′ UTR BDNF mRNA in spine morphology and synaptic plasticity in hippocampal neurons. Cell 134: 175–187 - PMC - PubMed
    1. Anders S, Huber W 2010. Differential expression analysis for sequence count data. Genome Biol 11: R106. - PMC - PubMed
    1. Anders S, Reyes A, Huber W 2012. Detecting differential usage of exons from RNA-seq data. Genome Res 22: 2008–2017 - PMC - PubMed
    1. Ascano M, Hafner M, Cekan P, Gerstberger S, Tuschl T 2012. Identification of RNA–protein interaction networks using PAR-CLIP. Wiley Interdiscip Rev RNA 3: 159–177 - PMC - PubMed

Publication types

MeSH terms

Associated data