Cell number changes in Alzheimer's disease relate to dementia, not to plaques and tangles
- PMID: 24136825
- PMCID: PMC3859218
- DOI: 10.1093/brain/awt273
Cell number changes in Alzheimer's disease relate to dementia, not to plaques and tangles
Abstract
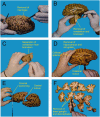
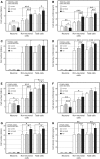
Alzheimer's disease is the commonest cause of dementia in the elderly, but its pathological determinants are still debated. Amyloid-β plaques and neurofibrillary tangles have been implicated either directly as disruptors of neural function, or indirectly by precipitating neuronal death and thus causing a reduction in neuronal number. Alternatively, the initial cognitive decline has been attributed to subtle intracellular events caused by amyloid-β oligomers, resulting in dementia after massive synaptic dysfunction followed by neuronal degeneration and death. To investigate whether Alzheimer's disease is associated with changes in the absolute cell numbers of ageing brains, we used the isotropic fractionator, a novel technique designed to determine the absolute cellular composition of brain regions. We investigated whether plaques and tangles are associated with neuronal loss, or whether it is dementia that relates to changes of absolute cell composition, by comparing cell numbers in brains of patients severely demented with those of asymptomatic individuals-both groups histopathologically diagnosed as Alzheimer's-and normal subjects with no pathological signs of the disease. We found a great reduction of neuronal numbers in the hippocampus and cerebral cortex of demented patients with Alzheimer's disease, but not in asymptomatic subjects with Alzheimer's disease. We concluded that neuronal loss is associated with dementia and not the presence of plaques and tangles, which may explain why subjects with histopathological features of Alzheimer's disease can be asymptomatic; and exclude amyloid-β deposits as causes for the reduction of neuronal numbers in the brain. We found an increase of non-neuronal cell numbers in the cerebral cortex and subcortical white matter of demented patients with Alzheimer's disease when compared with asymptomatic subjects with Alzheimer's disease and control subjects, suggesting a reactive glial cell response in the former that may be related to the symptoms they present.
Keywords: ageing; amyloid-β; dementia; isotropic fractionator; neuronal loss.
Figures


Similar articles
-
Dissecting phenotypic traits linked to human resilience to Alzheimer's pathology.Brain. 2013 Aug;136(Pt 8):2510-26. doi: 10.1093/brain/awt171. Epub 2013 Jul 3. Brain. 2013. PMID: 23824488 Free PMC article.
-
Distinct cytokine profiles in human brains resilient to Alzheimer's pathology.Neurobiol Dis. 2019 Jan;121:327-337. doi: 10.1016/j.nbd.2018.10.009. Epub 2018 Oct 15. Neurobiol Dis. 2019. PMID: 30336198 Free PMC article.
-
The distribution of tangles, plaques and related immunohistochemical markers in healthy aging and Alzheimer's disease.Neurobiol Aging. 1991 Jul-Aug;12(4):295-312. doi: 10.1016/0197-4580(91)90006-6. Neurobiol Aging. 1991. PMID: 1961359
-
Neuropathology of Alzheimer's disease: a critical update.J Neural Transm Suppl. 1998;54:77-95. doi: 10.1007/978-3-7091-7508-8_8. J Neural Transm Suppl. 1998. PMID: 9850917 Review.
-
[Involvement of beta-amyloid in the etiology of Alzheimer's disease].Brain Nerve. 2010 Jul;62(7):691-9. Brain Nerve. 2010. PMID: 20675873 Review. Japanese.
Cited by
-
Therapeutic potential of a TrkB agonistic antibody for Alzheimer's disease.Theranostics. 2020 May 23;10(15):6854-6874. doi: 10.7150/thno.44165. eCollection 2020. Theranostics. 2020. PMID: 32550908 Free PMC article.
-
APP dyshomeostasis in the pathogenesis of Alzheimer's disease: implications for current drug targets.Alzheimers Res Ther. 2024 Jun 29;16(1):144. doi: 10.1186/s13195-024-01504-w. Alzheimers Res Ther. 2024. PMID: 38951839 Free PMC article. Review.
-
The link between chronic pain and Alzheimer's disease.J Neuroinflammation. 2019 Nov 6;16(1):204. doi: 10.1186/s12974-019-1608-z. J Neuroinflammation. 2019. PMID: 31694670 Free PMC article. Review.
-
Neurovascular unit dysregulation, white matter disease, and executive dysfunction: the shared triad of vascular cognitive impairment and Alzheimer disease.Geroscience. 2020 Apr;42(2):445-465. doi: 10.1007/s11357-020-00164-6. Epub 2020 Jan 30. Geroscience. 2020. PMID: 32002785 Free PMC article. Review.
-
A novel approach for integrative studies on neurodegenerative diseases in human brains.J Neurosci Methods. 2014 Apr 15;226:171-183. doi: 10.1016/j.jneumeth.2014.01.030. Epub 2014 Feb 3. J Neurosci Methods. 2014. PMID: 24503023 Free PMC article.
References
-
- Aletrino MA, Vogels OJ, Van Domburg PH, Ten Donkelaar HJ. Cell loss in the nucleus raphes dorsalis in Alzheimer’s disease. Neurobiol Aging. 1992;13:461–8. - PubMed
-
- Alzheimer A. Uber einen eigenartige Erkranung der Himrinde. Allgem Zeit Psychiatr Psychisch-Gerichtisch Med. 1907;64:146–8.
-
- Andersen K, Andersen BB, Pakkenberg B. Stereological quantification of the cerebellum in patients with Alzheimer’s disease. Neurobiol Aging. 2012;33:11–20. - PubMed
-
- Azevedo FAC, Andrade-Moraes CH, Curado MR, Oliveira-Pinto AV, Guimarães DM, Szczupak D, et al. Automatic isotropic fractionation for quantitative cell analysis of large brains and brain regions. J Neurosci Meth. 2013;212:72–8. - PubMed
Publication types
MeSH terms
Substances
Grants and funding
LinkOut - more resources
Full Text Sources
Other Literature Sources
Medical

