. 2013;9(10):e1003872.
doi: 10.1371/journal.pgen.1003872. Epub 2013 Oct 10.

Function and evolution of DNA methylation in Nasonia vitripennis

Affiliations

Function and evolution of DNA methylation in Nasonia vitripennis

Xu Wang et al. PLoS Genet. 2013.

Abstract

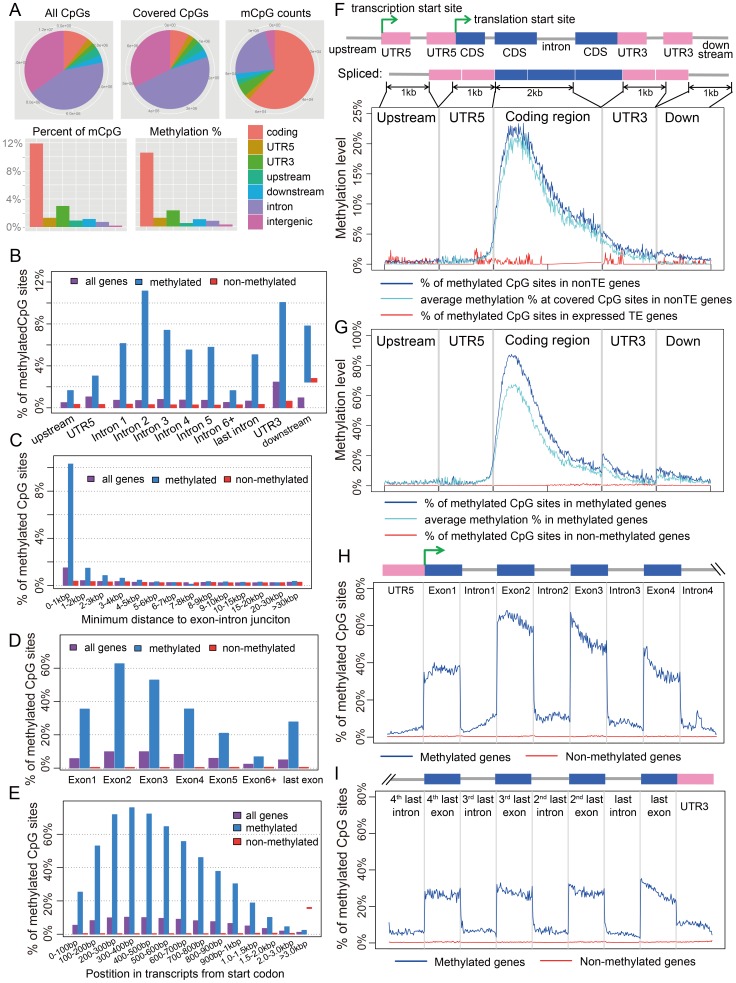
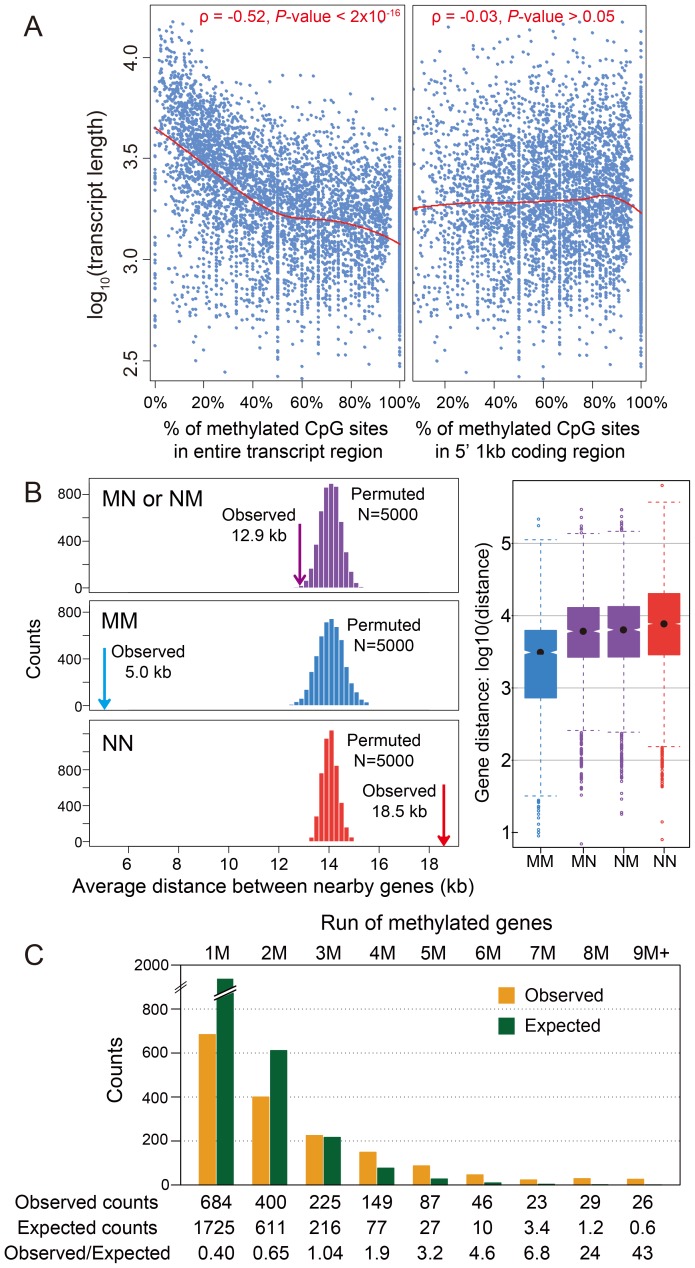
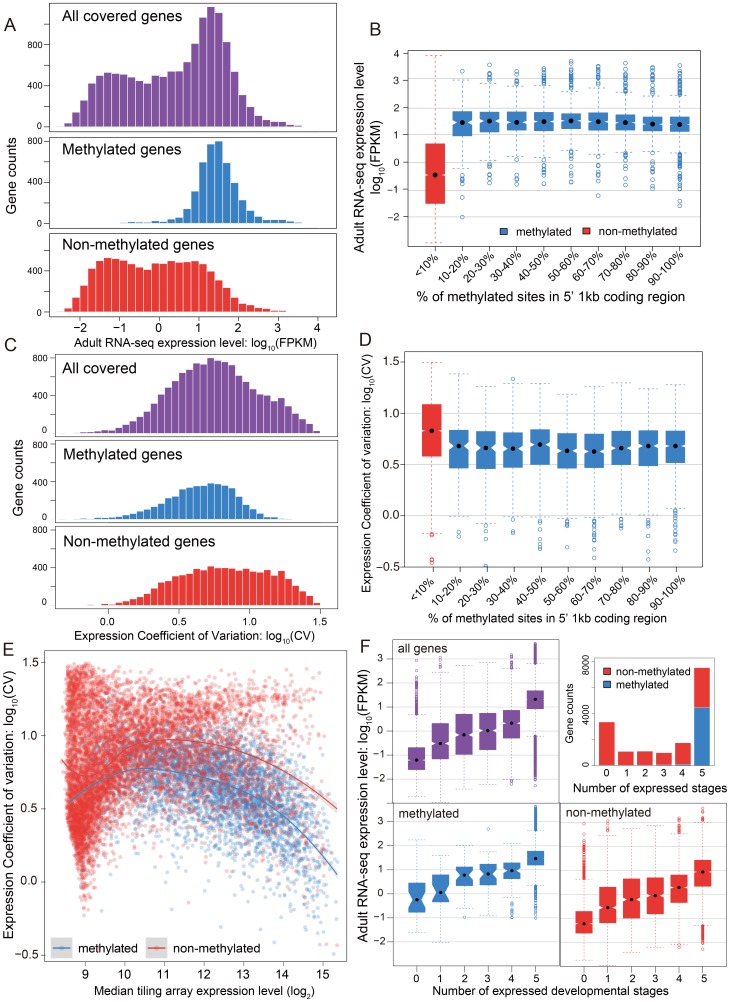
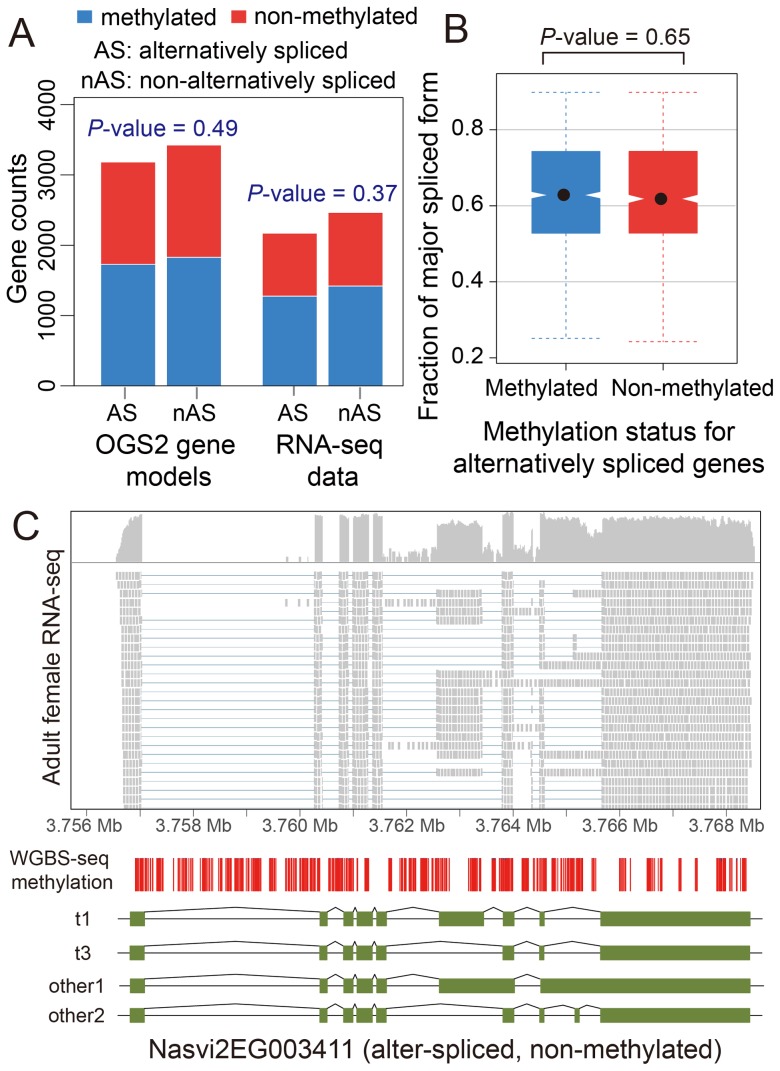
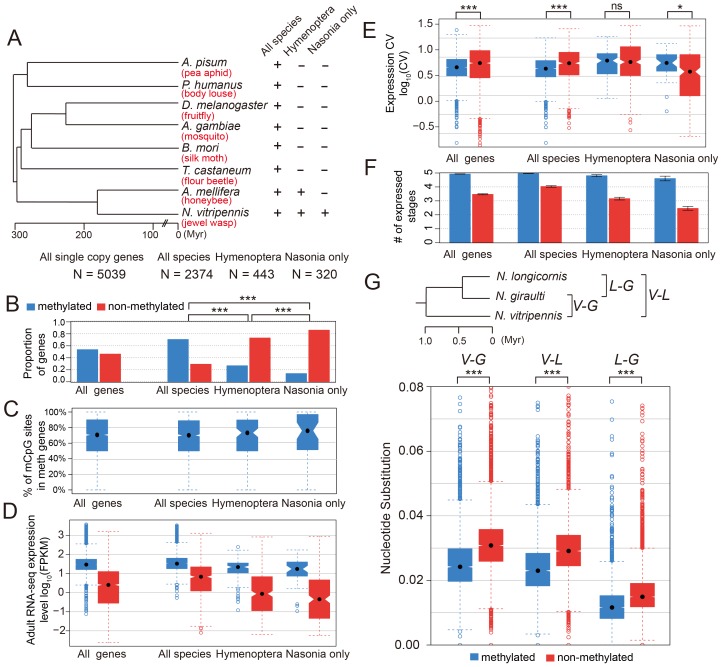
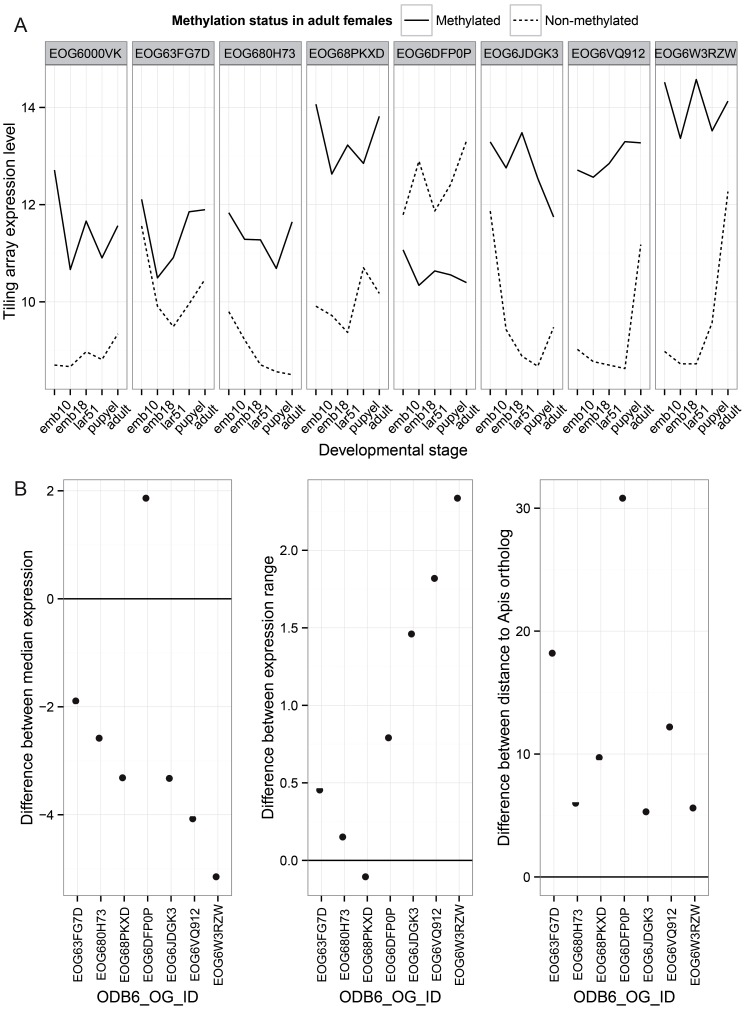
The parasitoid wasp Nasonia vitripennis is an emerging genetic model for functional analysis of DNA methylation. Here, we characterize genome-wide methylation at a base-pair resolution, and compare these results to gene expression across five developmental stages and to methylation patterns reported in other insects. An accurate assessment of DNA methylation across the genome is accomplished using bisulfite sequencing of adult females from a highly inbred line. One-third of genes show extensive methylation over the gene body, yet methylated DNA is not found in non-coding regions and rarely in transposons. Methylated genes occur in small clusters across the genome. Methylation demarcates exon-intron boundaries, with elevated levels over exons, primarily in the 5' regions of genes. It is also elevated near the sites of translational initiation and termination, with reduced levels in 5' and 3' UTRs. Methylated genes have higher median expression levels and lower expression variation across development stages than non-methylated genes. There is no difference in frequency of differential splicing between methylated and non-methylated genes, and as yet no established role for methylation in regulating alternative splicing in Nasonia. Phylogenetic comparisons indicate that many genes maintain methylation status across long evolutionary time scales. Nasonia methylated genes are more likely to be conserved in insects, but even those that are not conserved show broader expression across development than comparable non-methylated genes. Finally, examination of duplicated genes shows that those paralogs that have lost methylation in the Nasonia lineage following gene duplication evolve more rapidly, show decreased median expression levels, and increased specialization in expression across development. Methylation of Nasonia genes signals constitutive transcription across developmental stages, whereas non-methylated genes show more dynamic developmental expression patterns. We speculate that loss of methylation may result in increased developmental specialization in evolution and acquisition of methylation may lead to broader constitutive expression.


Conflict of interest statement

The authors have declared that no competing interests exist.

Figures

Figure 1
Figure 1. Distribution of CpG DNA methylation in the Nasonia genome across protein-coding genes.
(A) Distributions across genomic features for all 14 million CpG sites (Top left), 8 million covered CpG sites (Top middle) and methylated CpG sites (mCpGs, Top right). Plotted in the bottom panel are the distributions for percentage of mCpGs and methylation percentage at covered CpG sites. (B) Percentage of mCpGs in the 1 kbp upstream, 1 kbp downstream, UTR and intronic regions for methylated (blue), non-methylated (red) and all genes (purple). (C) Percentage of mCpGs in introns for methylated (blue), non-methylated (red) and all genes (purple), binned by the nearest distance to the exon-intron junctions. (D) Percentage of mCpGs across exons for methylated (blue), non-methylated (red) and all genes (purple). (E) Percentage of mCpGs in the coding region starting from first codon for methylated (blue), non-methylated (red) and all genes (purple). (F) Methylation level in 1 kbp upstream, 1 kbp 5′-UTR, first 2 kbp coding, 1 kbp 3′-UTR and 1 kbp downstream regions for 1,540 expressed transposable element genes (TE genes) and 16,186 non-TE genes. Dark blue line: percentage of mCpGs for non-TE genes; light blue line: average methylation percentage across covered CpGs for non-TE genes; red line: percentage of mCpGs for TE genes. (G) Methylation level in 1 kbp upstream, 1 kbp 5′-UTR, first 2 kbp coding, 1 kbp 3′-UTR and 1 kbp downstream regions for 4,751 methylated non-TE genes and 12,975 non-methylated non-TE genes. Dark blue line: percentage of mCpGs for methylated genes; light blue line: average methylation percentage across covered CpGs for methylated genes; red line: percentage of mCpGs for non-methylated genes. (H–I) Plot of Percentage of methylated CpG sites in the 5′UTR, the first four exons and introns (H) and 3′UTR, the last four exons and introns (I) for methylated (blue) and non-methylated genes (red). All exons, introns and UTRs were rescaled to the same length.
Figure 2
Figure 2. DNA methylation and gene length, exon number and gene locations.
(A) Scatterplot for gene length (log10) and percentage of methylated CpG sites for methylation genes in the entire transcript region (left) and in 5′ 1 kbp coding region (right). The fitted lines using non-parametric local regression are shown in red. (B) Left: Distance between neighboring methylated genes (MM), non-methylated genes (NN) and methylated-non-methylated genes (MN or NM). The expected distributions for the three classes calculated by permuting the methylation status (N = 5,000) were plotted (MM: blue; NN: red; MN or NM: purple). The observed mean distance for each group was shown using arrows. Right: Distribution of the distance for the four classes (MM, NN, MN and NM). (C) Distribution of observed (orange) and expected (blue) counts for consecutive run of methylated genes. The expected counts were computed assuming the methylation status is randomly distributed.
Figure 3
Figure 3. DNA methylation, gene expression and expression breadth.
(A) Distribution of RNA-seq expression level (log10 FPKM) in adult female for methylated (blue), non-methylated (red) and all genes (purple). (B) Distribution of RNA-seq expression level (log10 FPKM) in adult female for groups of genes binned by percentage of methylated CpG sites in 5′ 1 kbp coding region. Red: non-methylation genes; blue: methylated genes. (C) Histograms for distribution of expression coefficient of variation (log10 expression CV) in five developmental stages (early embryo, late embryo, larvae, pupae and adult) for methylated (blue), non-methylated (red) and all genes (purple). (D) Distribution of expression breadth measurement (log10 expression CV) in six developmental stages for groups of genes binned by percentage of methylated CpG sites in 5′ 1 kbp coding region. Red: non-methylation genes; blue: methylated genes. (E) Scatterplot of expression breadth (log2 expression CV) on y-axis against median expression level (log2 signal intensity) in tiling array on x-axis, color-coded by adult female methylation status (blue: methylated genes; red: non-methylated genes). Fitted lines using non-parametric local regression are shown for methylated and non-methylated genes respectively. (F) Top right panel: Stacked barplot for expressed methylated and non-methylated genes with 0 to 6 expressed stages. Red: unmethylation genes; blue: methylated genes. Top left and bottom panel: boxplot for distribution of adult female RNA-seq expression level (log10 FPKM) for methylated (in blue), non-methylated (in red) and all genes (in purple) expressed in 0–5 developmental stages.
Figure 4
Figure 4. DNA methylation and alternative splicing.
(A) Counts of alternatively spliced and non-alternatively spliced genes with different methylation status from OGS2 gene models (left) and RNA-seq data (right). AS: alternatively spliced; nAS: non-alternatively spliced. Methylated is shown in blue and non-methylated shown in red. (B) Distribution of fraction of major spliced forms for alternatively spliced methylated (blue) and non-methylated genes (red). (C) Gene expression, DNA methylation and alternative splicing profile for a non-methylated gene Nasvi2EG003411. Plotted at the top is the IGV browser screenshot showing adult female RNA-seq coverage (on log scale) and read alignments in the gene region. Plotted at the bottom are the CpG methylation profile at covered CpG sites from WGBS-seq data and the exon model of the alternatively spliced transcripts from OGS2 gene models. A vertical bar was drawn for each CpG at its position in the gene, color-coded by the methylation percentage in proportion to the bar length (blue: methylated Cs; red: non-methylated Cs). All 587 covered CpGs in the gene region were non-methylated. Two of the three OGS2 transcript variants, Nasvi2EG003411t1 (labelled as t1) and Nasvi2EG003411t3 (labelled as t3), were covered in the RNA-seq data with 47% and 41% of the transcript abundance, respectively. Two of the remaining minor transcript variants (other1 and other2) were also plotted.
Figure 5
Figure 5. DNA methylation and gene conservation.
(A) Phylogenetic tree of eight insect species: Nasonia vitripennis, Apis mellifera, Tribolium castaneum, Bombyx mori, Anopheles gambiae, Drosophila melanogaster, Pediculus humanus and Acyrthosiphon pisum. The methylation status and correlating factors were plotted in (B–F) for four groups of genes: all 5,039 Nasonia single-copy genes with one or zero ortholog in seven other insect species, 2,374 genes with one orthologs in all eight insect species, 443 genes with one orthologs in Apis and Nasonia but missing in other six species, and 320 genes present only in Nasonia. The y-axes plotted in (B–F) are (B): proportion of methylated (blue) and non-methylated genes (red); (C): percentage of methylated CpG sites in methylated genes; (D): adult RNA-seq expression levels (log10FPKM); (E): coefficient of variation of expression level in tiling array across six developmental stages; (F): number of expressed tissues. (G) Top: Phylogenetic tree of three Nasonia species: N. longicornis (L), N. giraulti (G) and N. vitripennis (V). Bottom: boxplots of nucleotide substitution rates between V–L, V–G and L–G.
Figure 6
Figure 6. Paralog analysis.
Differences between two paralogs that have changed in methylation status in the Nasonia lineage are shown. (A) Comparisons of expression pattern across developmental stages for duplicated genes in the Nasonia lineage where one gene is methylated (M) and the other lost methylation (N). These genes have 1∶1 orthologs in other hymenopteran species, and the ortholog is methylated in Apis. (B) Those paralogs that lost methylation show significant reductions in median expression level across development relative to the M paralog (N–M), significant increases in the range of expression level (N–M), and significantly greater divergence from the Apis ortholog (N–M).

Similar articles

Cited by

References

    1. He XJ, Chen T, Zhu JK (2011) Regulation and function of DNA methylation in plants and animals. Cell Res 21: 442–465. - PMC - PubMed
    1. Jones PA (2012) Functions of DNA methylation: islands, start sites, gene bodies and beyond. Nat Rev Genet 13: 484–492. - PubMed
    1. Klose RJ, Bird AP (2006) Genomic DNA methylation: the mark and its mediators. Trends Biochem Sci 31: 89–97. - PubMed
    1. Suzuki MM, Bird A (2008) DNA methylation landscapes: provocative insights from epigenomics. Nat Rev Genet 9: 465–476. - PubMed
    1. Bird A (2002) DNA methylation patterns and epigenetic memory. Genes Dev 16: 6–21. - PubMed

Publication types