. 2013 Nov;142(5):493-505.
doi: 10.1085/jgp.201311068. Epub 2013 Oct 14.

The role of transmembrane channel-like proteins in the operation of hair cell mechanotransducer channels

Affiliations

The role of transmembrane channel-like proteins in the operation of hair cell mechanotransducer channels

Kyunghee X Kim et al. J Gen Physiol. 2013 Nov.

Abstract

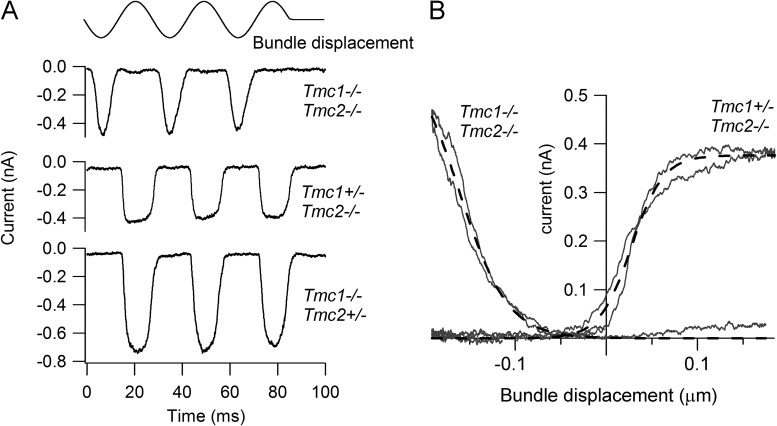
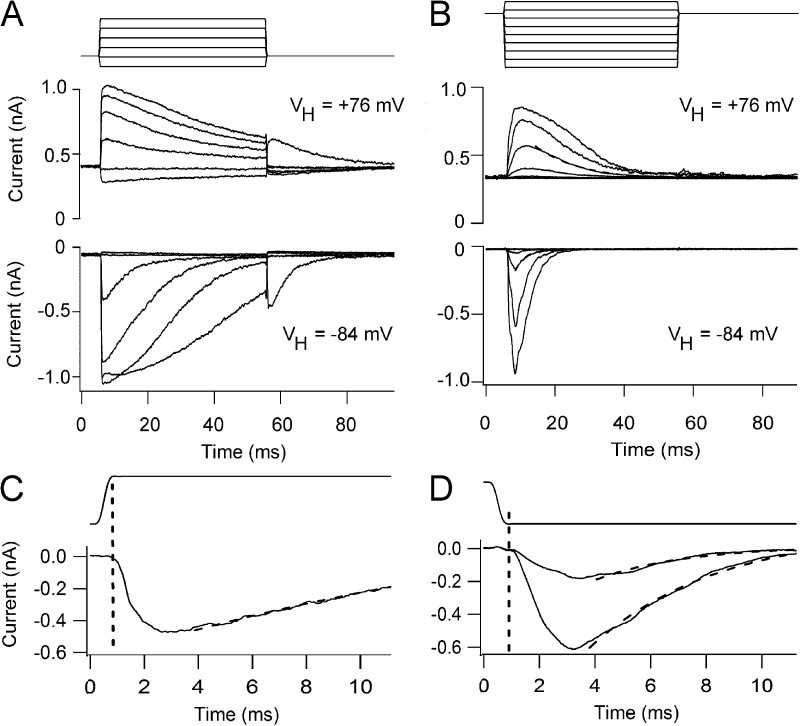
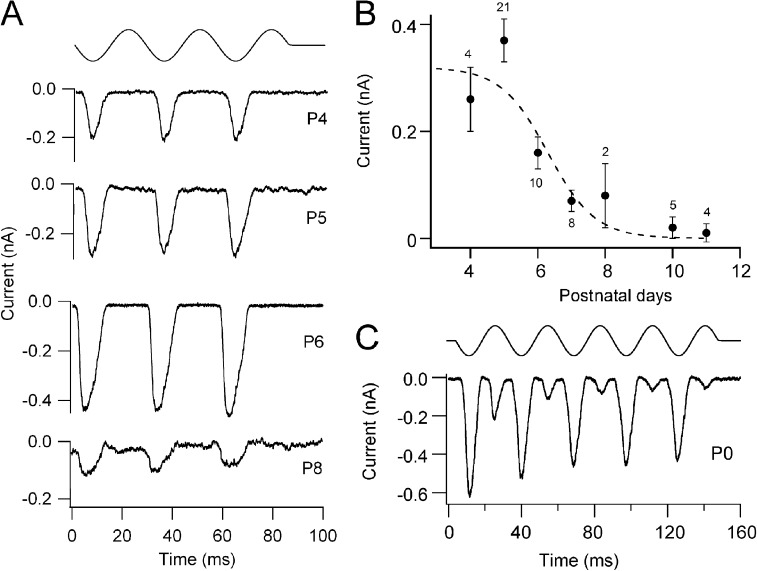
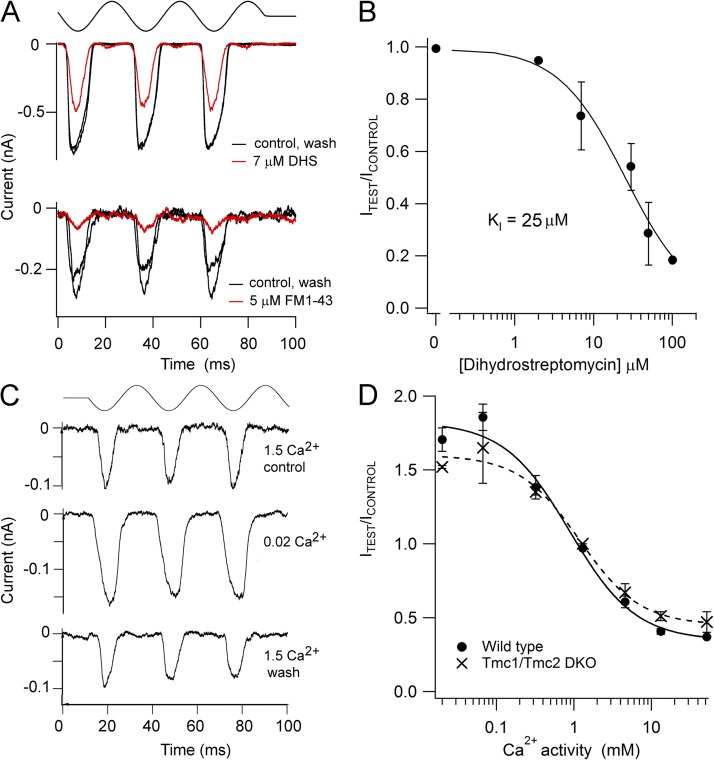
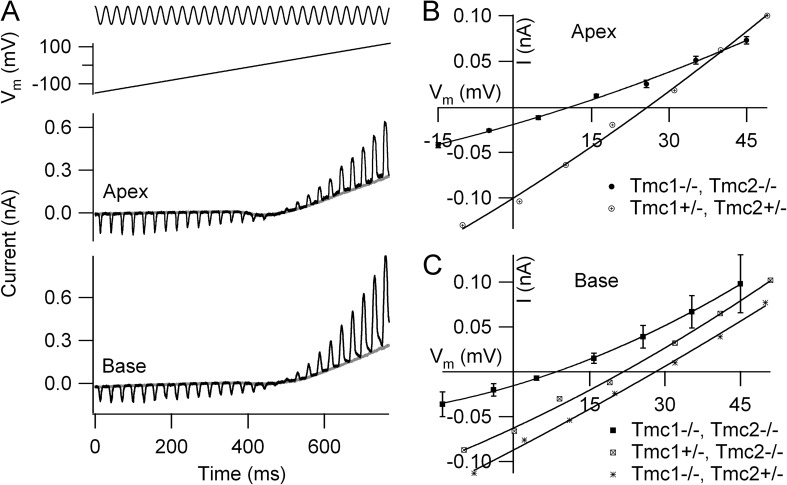
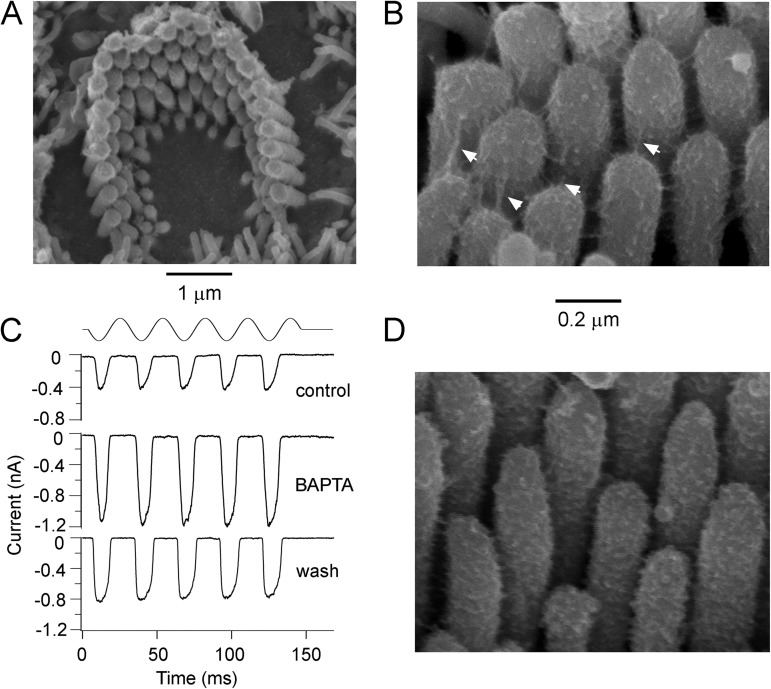
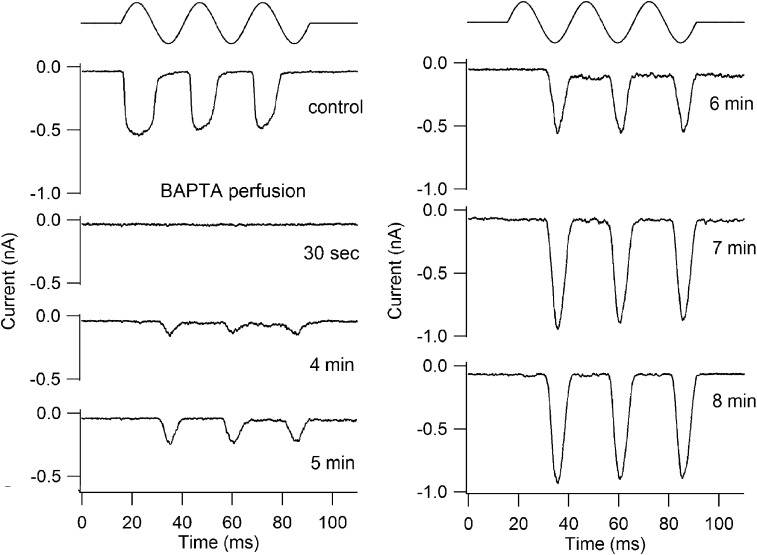
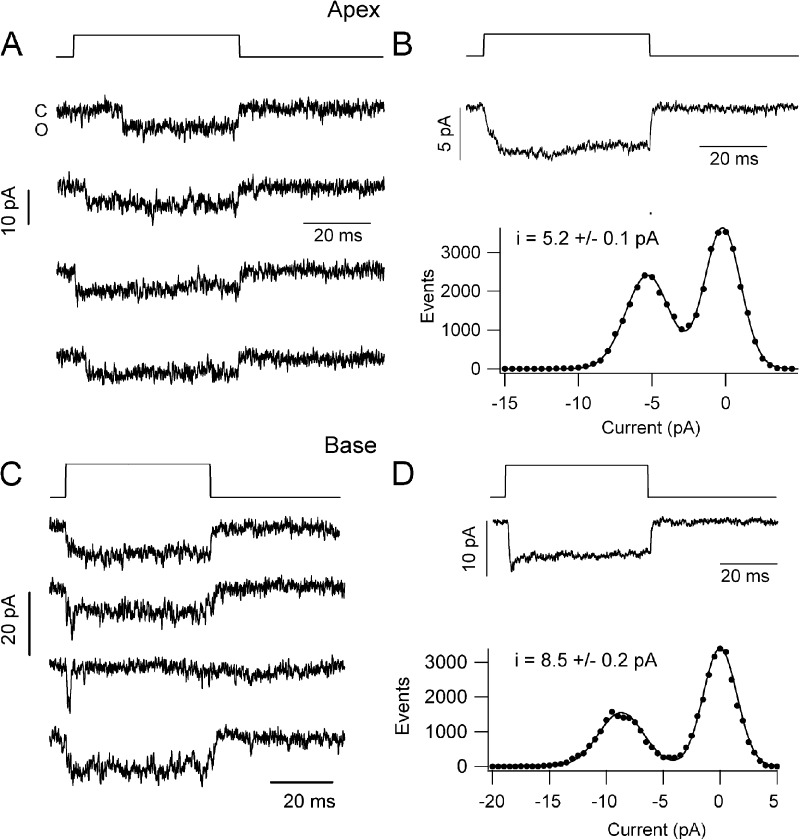
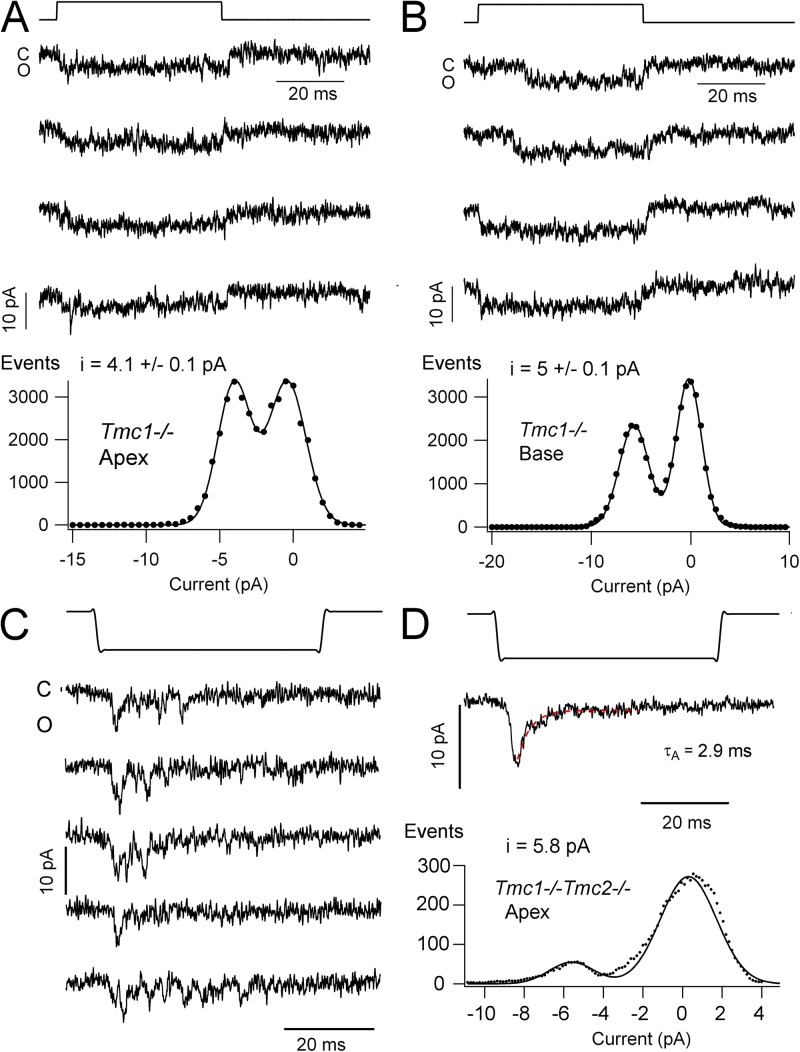
Sound stimuli elicit movement of the stereocilia that make up the hair bundle of cochlear hair cells, putting tension on the tip links connecting the stereocilia and thereby opening mechanotransducer (MT) channels. Tmc1 and Tmc2, two members of the transmembrane channel-like family, are necessary for mechanotransduction. To assess their precise role, we recorded MT currents elicited by hair bundle deflections in mice with null mutations of Tmc1, Tmc2, or both. During the first postnatal week, we observed a normal MT current in hair cells lacking Tmc1 or Tmc2; however, in the absence of both isoforms, we recorded a large MT current that was phase-shifted 180°, being evoked by displacements of the hair bundle away from its tallest edge rather than toward it as in wild-type hair cells. The anomalous MT current in hair cells lacking Tmc1 and Tmc2 was blocked by FM1-43, dihydrostreptomycin, and extracellular Ca(2+) at concentrations similar to those that blocked wild type. MT channels in the double knockouts carried Ca(2+) with a lower permeability than wild-type or single mutants. The MT current in double knockouts persisted during exposure to submicromolar Ca(2+), even though this treatment destroyed the tip links. We conclude that the Tmc isoforms do not themselves constitute the MT channel but are essential for targeting and interaction with the tip link. Changes in the MT conductance and Ca(2+) permeability observed in the absence of Tmc1 mutants may stem from loss of interaction with protein partners in the transduction complex.


Figures

Figure 1.
Figure 1.
Reverse-polarity MT currents in OHCs of Tmc1−/−Tmc2−/− double knockouts. (A) Examples of MT currents in response to sinusoidal deflections of the hair bundle for a P2 Tmc1−/−Tmc2−/− double knockout and for P2 Tmc1−/−Tmc2+/− and P3 Tmc1+/−Tmc2−/− mice. All recordings from basal OHCs at a holding potential of −84 mV; stimulus monitor, the driving voltage to the fluid jet, is shown at the top. In this and subsequent figures, a positive driving voltage denotes displacement toward the tallest edge of the hair bundle. Note that the double knockout response occurs on the opposite phase of the stimulus to those in the heterozygote plus single knockouts. (B) Current–displacement (I-X) relationships for the Tmc1−/−Tmc2−/− and for the Tmc1+/−Tmc2−/− recordings. MT current over the first cycle of the response was plotted against bundle displacement, inferred by calibrating hair bundle motion (see Materials and methods). Dashed lines are fits with single-state Boltzmann: I = Imax/(1 + exp(−((X−X1)/X2))), where X1 is the half-activation displacement, X2 is rate, and Imax is maximum current. Parameter values for Tmc1+/−Tmc2−/−: Imax, 0.38 nA; X1, 27 nm; X2, 18 nm. Parameter values for Tmc1−/−Tmc2−/−: Imax, 0.66 nA; X1, −165 nm; X2, −33 nm.
Figure 2.
Figure 2.
MT currents in response to fluid jet step stimuli. (A) Family of MT currents evoked by step deflections of the hair bundle in an apical OHC from a P5 Tmc1+/−Tmc2+/− heterozygote at +76 mV (top) and −84 mV (bottom). (B) Family of MT currents evoked by hair bundle steps in a P4 apical OHC from a Tmc1−/−Tmc2−/− double knockout at +76 mV (top) and −84 mV (bottom). The driving voltage to the fluid jet, low-pass filtered at 1 kHz, is shown above the currents. (C) Onset of one of the currents in a P5 heterozygote apical OHC shown on a faster time base; dashed line, fit with a decay time constant of 16 ms. (D) Onset of two currents of a P4 apical OHC from a Tmc1−/−Tmc2−/− double knockout on a faster time base; dashed lines, fits with time constants of 3.3 and 6.3 ms. Note the response delay is similar in the heterozygote and double knockout.
Figure 3.
Figure 3.
Development of reverse-polarity MT currents in Tmc1−/−Tmc2−/− double knockouts. (A) Examples of reverse-polarity MT currents in apical OHCs of Tmc1−/−Tmc2−/− double knockout mice at four postnatal ages, given beside each trace. (B) Plot of the mean reverse-polarity MT current (±SEM) against postnatal age; numbers of cells are given above points. Time course of current, I, fitted with a sigmoidal decay: I = Imax/(1 + exp(−(T−T0.5)/TR)), with Imax = 0.32 nA, decay half-time T0.5 = 6.3 ± 0.6 d, and rate TR = 0.7 d. (C) Example of MT current in Tmc1−/−Tmc2−/− in a P0 OHC; the reverse-polarity component of the two-harmonic response is larger.
Figure 4.
Figure 4.
Permeability and block of the reverse-polarity MT current in Tmc1−/−Tmc2−/−. (A) Current is reversibly reduced by 5 µM FM1-43 and by 7 µM dihydrosteptomycin in P5 apical OHCs. (B) Dose–response relationship for block of the reverse-polarity current by dihydrosteptomycin, with two to three OHCs assayed at each concentration. Results fit with a Hill equation with a half-blocking concentration, KI, of 25 ± 6 µM and a Hill coefficient of 1.02 ± 0.2. Note the break in the abscissa at 0.2 µM. (C) Reducing extracellular Ca2+ bathing the hair bundle from 1.5 mM (perilymph) to 0.02 mM (endolymph) augments the reverse-polarity MT current in a P6 apical OHC. Top traces in A and C are the driving voltage to the fluid jet stimulator. (D) Plot of mean MT current against the Ca2+ activity in the saline bathing the hair bundle in wild-type (closed circles) and Tmc1−/−Tmc2−/− (crosses) apical OHCs. The measurements were performed by changing the bundle perfusate from saline with 1.5 mM Ca2+ to one containing the test Ca2+ concentration, and then washing in 1.5 mM Ca2+. All MT currents are normalized to that in 1.5 mM Ca2+ control and wash. 4–10 cells were averaged for the wild type, and 2–5 cells were averaged for the Tmc1−/−Tmc2−/−. Points were fitted with Hill plots with half-blocking concentration: KI = 0.9 ± 0.3 mM and Hill coefficient of 1.0 ± 0.3 for wild type, and KI = 1.2 ± 0.3 mM and Hill coefficient of 1.1 ± 0.3 for Tmc1−/−Tmc2−/−.
Figure 5.
Figure 5.
Ca2+ permeability of OHC MT currents. (A) Examples of reverse-polarity currents in a P5 apical OHC and a P2 basal OHC of Tmc1−/−Tmc2−/− mice. Hair bundle stimulated continuously with a sinusoidal fluid jet (top trace) during a voltage ramp from −150 to +100 mV (second trace), apical and basal currents (third and fourth traces). Extracellular solution contains 100 mM CaCl2 (see Materials and methods for full composition). (B) Current–voltage plots around reversal for apical OHCs of Tmc1−/−Tmc2−/− (mean ± SEM; n = 6, P5) and Tmc1+/−Tmc2+/− heterozygous P5 littermates. (C) Current–voltage plots around reversal for basal OHCs of Tmc1−/−Tmc2−/− (mean ± SEM; n = 3, P2), Tmc1+/−Tmc2−/−, and Tmc1−/−Tmc2+/− P3 mice. Note that the double knockout MT currents at both apex and base reverse >10 mV more negative than the heterozygotes or single knockouts, implying a smaller Ca2+ permeability.
Figure 6.
Figure 6.
Apical OHC hair bundles and tip links in Tmc1−/−Tmc2−/−. (A) Scanning electron micrograph of an apical OHC bundle from a P6 double knockout showing an intact but rounded bundle. (B) High power scanning electron micrograph of the stereocilia of a P6 OHC bundle showing the tip links (arrowed) and inter-stereociliary side-to side links. (C) Reverse-polarity MT currents in a P5 apical OHC in a control 1.5 mM Ca2+ saline, during exposure to submicromolar Ca2+ solution buffered with 5 mM BAPTA, and after washing with the control saline. (D) High power scanning electron micrograph of the stereocilia of a P5 OHC bundle after the preparation was treated with 5 mM BAPTA for 5 min before fixation. Note the substantial loss of tip links, although some side-to-side links remain.
Figure 7.
Figure 7.
Effects of sustained perfusion of BAPTA on OHC MT currents. Examples of responses to sinusoidal fluid jet stimulation before and during perfusion with BAPTA in a P1 Tmc1+/−Tmc2+/+ OHC; numbers beside traces give the time after the start of BAPTA perfusion. Initially (control), an MT current of conventional polarity was recorded. After the onset of BAPTA perfusion at 0 s, the normal MT current disappeared, and thereafter, the reverse-polarity current appeared and grew to attain a maximal amplitude after 8 min.
Figure 8.
Figure 8.
Single MT channel currents in wild-type OHCs. (A) Examples of single-channel currents in a P4 apical OHC recorded in whole-cell mode with a holding potential of −84 mV; hair bundle deflected by a glass probe driven by a piezoactuator, time course shown above, displacement of ∼0.2 µm. (B; Top) Ensemble average currents of 30 responses for apical OHC channels in A. (Bottom) Amplitude histogram of channel event for the cell in A. Points fitted with two Gaussians with peak at 0 and −5.2 pA. (C) Examples of single-channel currents in a P3 basal OHC with recording and hair bundle stimulation as in A. (D; Top) Ensemble average currents of 23 responses for channels from OHC in C. (Bottom) Amplitude histogram of the OHC events in C, fitted with two Gaussians with peaks at 0 and −8.6 pA. The leak current, usually <0.1 nA, was subtracted from the records before constructing single-channel histograms.
Figure 9.
Figure 9.
Single MT channel currents in Tmc mutants. (A) Examples of single-channel currents in a P5 apical OHC holding potential of −84 mV. Hair bundle deflection is shown above, and amplitude histogram of the OHC channel currents is shown below, fitted with two Gaussians with peaks at 0 and −4.1 pA. (B; Top) Single-channel currents in a P3 basal OHC with recording and stimulation conditions as in A. (Bottom) Amplitude histogram of the OHC channel currents fitted with two Gaussians with peaks at 0 and −5.0 pA. The tonotopic gradient in the wild type is much diminished in Tmc1−/−. (C) Single-channel currents in a P6 apical OHC of Tmc1−/−Tmc2−/− at −84 mV. (D; Top) Ensemble average current of 14 responses; decay fitted with an exponential time constant of 2.9 ms. (Bottom) Amplitude histogram of events in C, fitted with two Gaussians; channel amplitude of −5.8 pA.

Comment in

Similar articles

Cited by

References

    1. Alagramam K.N., Goodyear R.J., Geng R., Furness D.N., van Aken A.F., Marcotti W., Kros C.J., Richardson G.P. 2011. Mutations in protocadherin 15 and cadherin 23 affect tip links and mechanotransduction in mammalian sensory hair cells. PLoS ONE. 6:e19183 10.1371/journal.pone.0019183 - DOI - PMC - PubMed
    1. Assad J.A., Shepherd G.M., Corey D.P. 1991. Tip-link integrity and mechanical transduction in vertebrate hair cells. Neuron. 7:985–994 10.1016/0896-6273(91)90343-X - DOI - PubMed
    1. Bats C., Farrant M., Cull-Candy S.G. 2013. A role of TARPs in the expression and plasticity of calcium-permeable AMPARs: Evidence from cerebellar neurons and glia. Neuropharmacology. 74:76–85 10.1016/j.neuropharm.2013.03.037 - DOI - PMC - PubMed
    1. Beurg M., Evans M.G., Hackney C.M., Fettiplace R. 2006. A large-conductance calcium-selective mechanotransducer channel in mammalian cochlear hair cells. J. Neurosci. 26:10992–11000 10.1523/JNEUROSCI.2188-06.2006 - DOI - PMC - PubMed
    1. Beurg M., Fettiplace R., Nam J.H., Ricci A.J. 2009. Localization of inner hair cell mechanotransducer channels using high-speed calcium imaging. Nat. Neurosci. 12:553–558 10.1038/nn.2295 - DOI - PMC - PubMed

Publication types