

An experimentally-informed coarse-grained 3-Site-Per-Nucleotide model of DNA: structure, thermodynamics, and dynamics of hybridization
- PMID: 24116642
- PMCID: PMC3808442
- DOI: 10.1063/1.4822042
An experimentally-informed coarse-grained 3-Site-Per-Nucleotide model of DNA: structure, thermodynamics, and dynamics of hybridization
Abstract
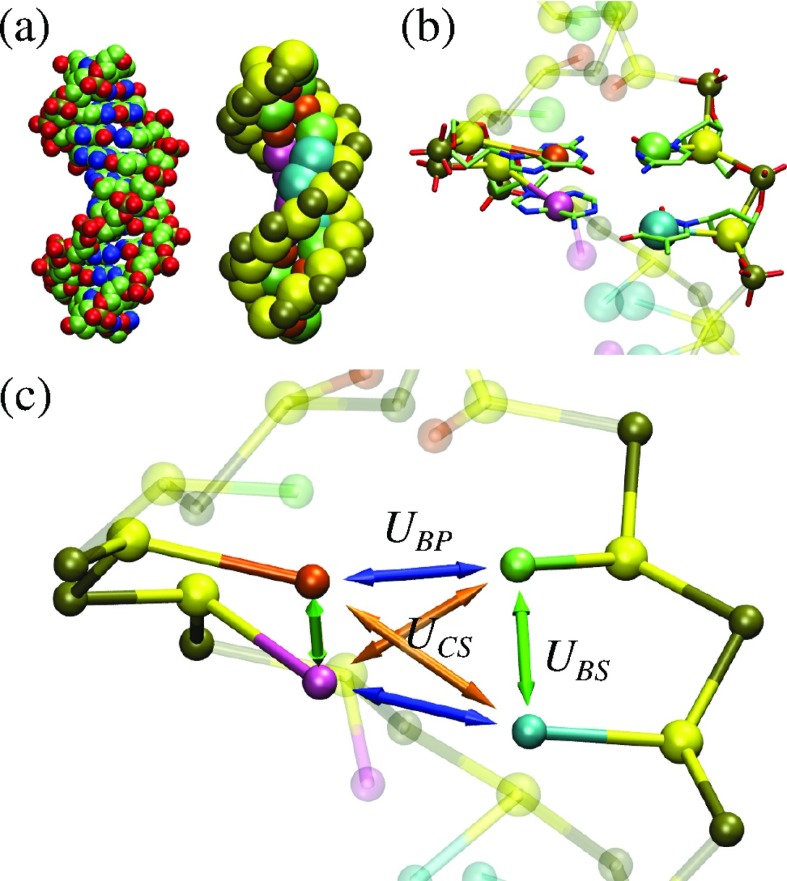
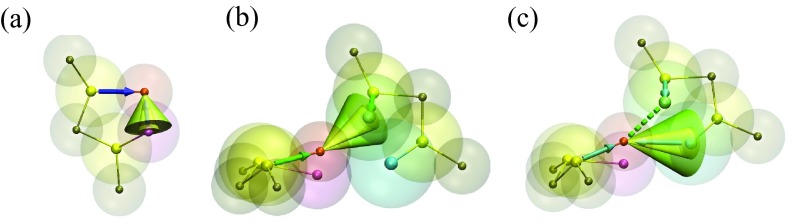
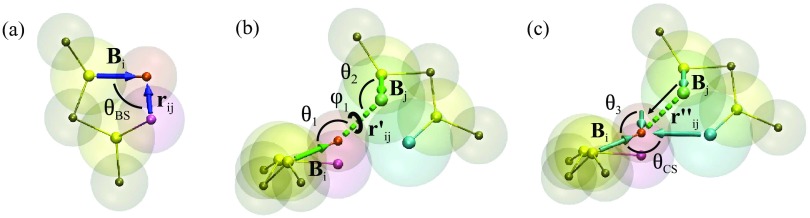
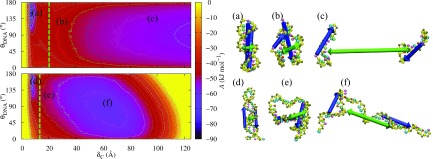
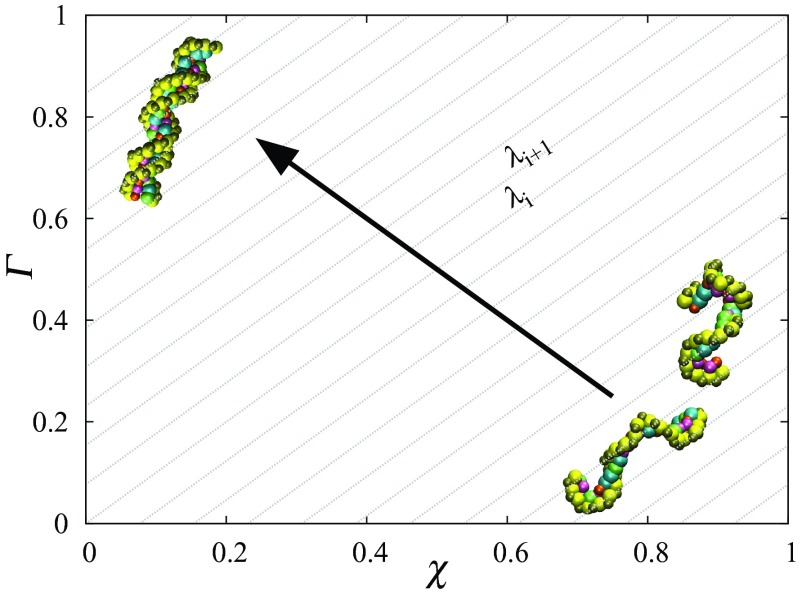
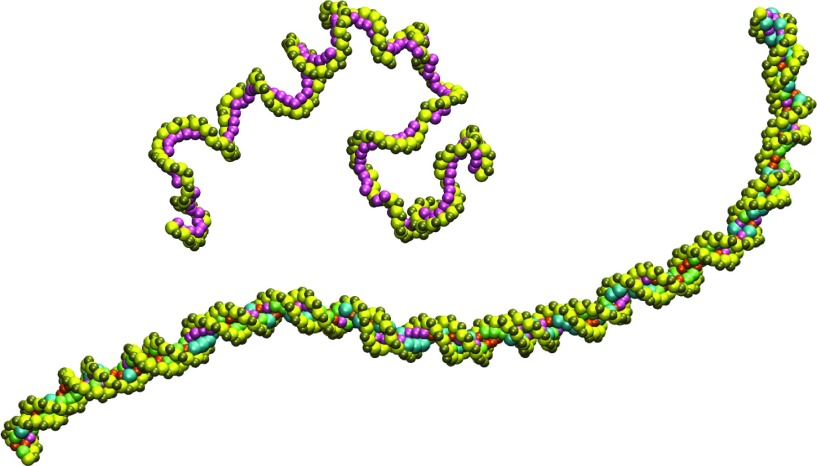
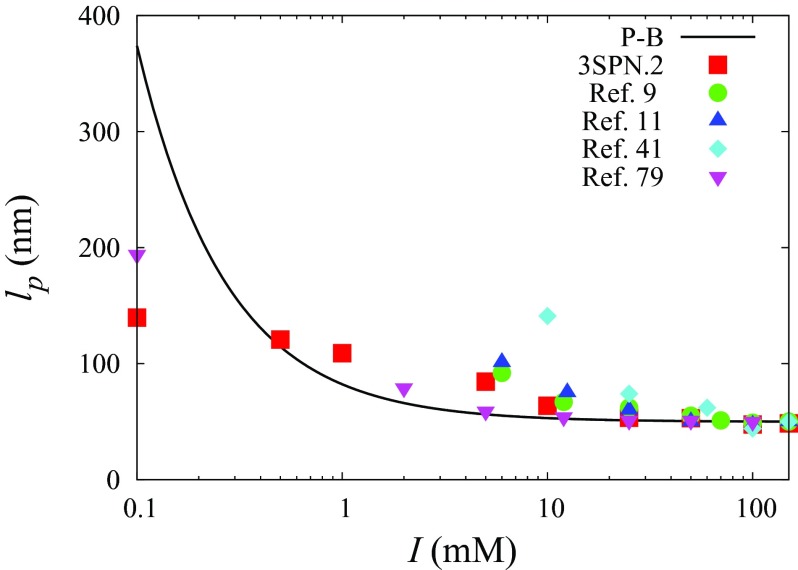
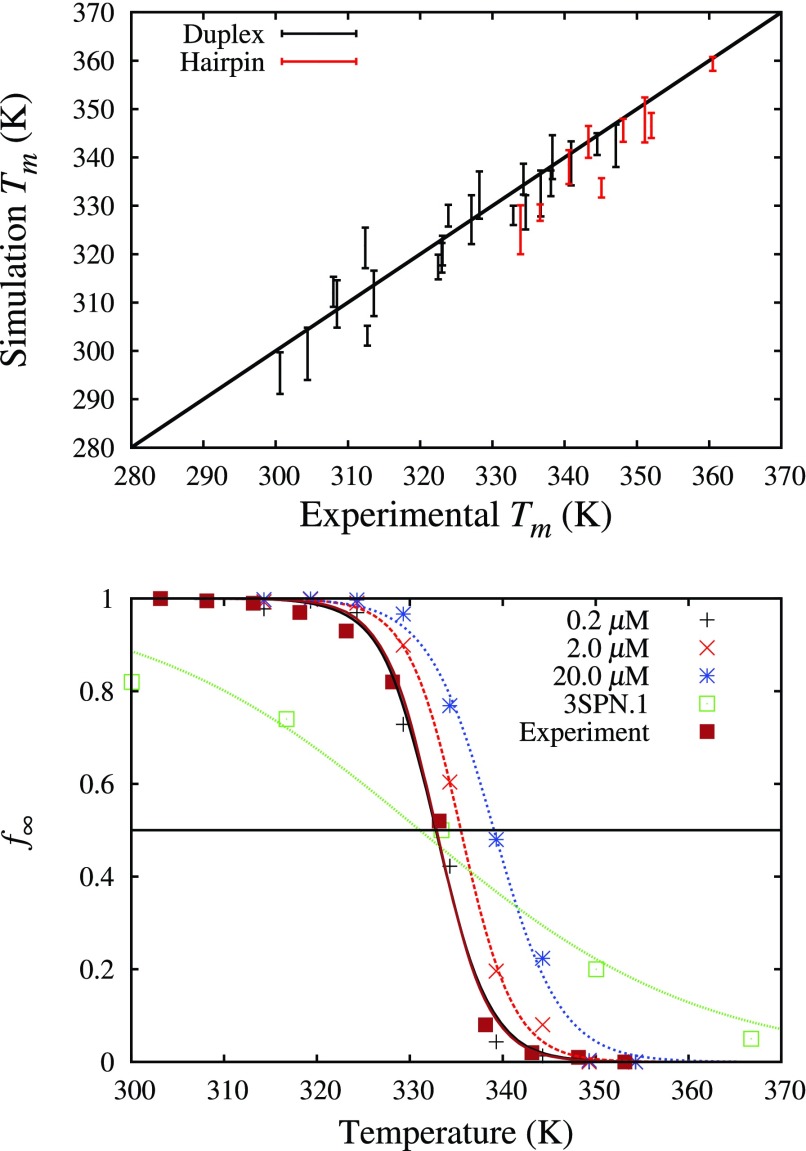
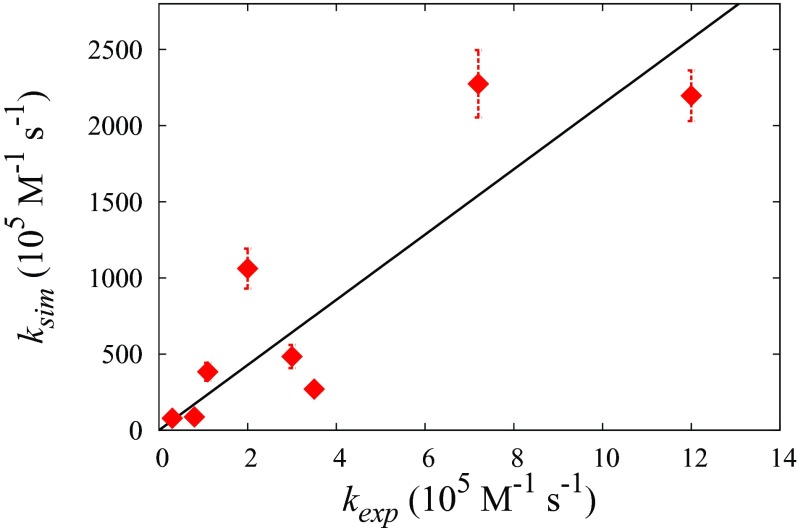
A new 3-Site-Per-Nucleotide coarse-grained model for DNA is presented. The model includes anisotropic potentials between bases involved in base stacking and base pair interactions that enable the description of relevant structural properties, including the major and minor grooves. In an improvement over available coarse-grained models, the correct persistence length is recovered for both ssDNA and dsDNA, allowing for simulation of non-canonical structures such as hairpins. DNA melting temperatures, measured for duplexes and hairpins by integrating over free energy surfaces generated using metadynamics simulations, are shown to be in quantitative agreement with experiment for a variety of sequences and conditions. Hybridization rate constants, calculated using forward-flux sampling, are also shown to be in good agreement with experiment. The coarse-grained model presented here is suitable for use in biological and engineering applications, including nucleosome positioning and DNA-templated engineering.
Figures
Similar articles
-
DNA hairpins destabilize duplexes primarily by promoting melting rather than by inhibiting hybridization.Nucleic Acids Res. 2015 Jul 27;43(13):6181-90. doi: 10.1093/nar/gkv582. Epub 2015 Jun 8. Nucleic Acids Res. 2015. PMID: 26056172 Free PMC article.
-
Coarse-grained simulations of RNA and DNA duplexes.J Phys Chem B. 2013 Jul 11;117(27):8047-60. doi: 10.1021/jp400786b. Epub 2013 Jun 26. J Phys Chem B. 2013. PMID: 23730911
-
Effect of backbone chemistry on hybridization thermodynamics of oligonucleic acids: a coarse-grained molecular dynamics simulation study.Soft Matter. 2016 Feb 28;12(8):2276-87. doi: 10.1039/c5sm02868j. Soft Matter. 2016. PMID: 26777980
-
Frontiers in molecular dynamics simulations of DNA.Acc Chem Res. 2012 Feb 21;45(2):196-205. doi: 10.1021/ar2001217. Epub 2011 Aug 10. Acc Chem Res. 2012. PMID: 21830782 Review.
-
Non-linear Hamiltonian models for DNA.Eur Biophys J. 2022 Sep;51(6):431-447. doi: 10.1007/s00249-022-01614-z. Epub 2022 Aug 17. Eur Biophys J. 2022. PMID: 35976412 Review.
Cited by
-
Molecular mechanism of parental H3/H4 recycling at a replication fork.Nat Commun. 2024 Nov 2;15(1):9485. doi: 10.1038/s41467-024-53187-4. Nat Commun. 2024. PMID: 39488545 Free PMC article.
-
PEST Control of Molecular Stripping of NFκB from DNA Transcription Sites.J Phys Chem B. 2016 Aug 25;120(33):8532-8. doi: 10.1021/acs.jpcb.6b02359. Epub 2016 May 3. J Phys Chem B. 2016. PMID: 27098223 Free PMC article.
-
Ab initio predictions for 3D structure and stability of single- and double-stranded DNAs in ion solutions.PLoS Comput Biol. 2022 Oct 19;18(10):e1010501. doi: 10.1371/journal.pcbi.1010501. eCollection 2022 Oct. PLoS Comput Biol. 2022. PMID: 36260618 Free PMC article.
-
Single-molecule biophysics experiments in silico: Toward a physical model of a replisome.iScience. 2022 Apr 18;25(5):104264. doi: 10.1016/j.isci.2022.104264. eCollection 2022 May 20. iScience. 2022. PMID: 35521518 Free PMC article.
-
Brewing COFFEE: A sequence-specific coarse-grained energy function for simulations of DNA-protein complexes.bioRxiv [Preprint]. 2023 Aug 1:2023.06.07.544064. doi: 10.1101/2023.06.07.544064. bioRxiv. 2023. Update in: J Chem Theory Comput. 2024 Feb 13;20(3):1398-1413. doi: 10.1021/acs.jctc.3c00833. PMID: 37333386 Free PMC article. Updated. Preprint.
References
-
- Lyubartsev A. P. and Nordenskiöld L., J. Phys. Chem. B 101, 4335 (1997).10.1021/jp963982w - DOI
-
- Jian H., Vologodskii A. V., and Schlick T., J. Comput. Phys. 136, 168 (1997).10.1006/jcph.1997.5765 - DOI
-
- Jendrejack R. M., de Pablo J. J., and Graham M. D., J. Chem. Phys. 116, 7752 (2002).10.1063/1.1466831 - DOI
Publication types
MeSH terms
Substances
Grants and funding
LinkOut - more resources
Full Text Sources
Other Literature Sources