. 2013 Oct;11(10):e1001674.
doi: 10.1371/journal.pbio.1001674. Epub 2013 Oct 8.

TGF-β signalling is required for CD4⁺ T cell homeostasis but dispensable for regulatory T cell function

Affiliations

TGF-β signalling is required for CD4⁺ T cell homeostasis but dispensable for regulatory T cell function

Anna Sledzińska et al. PLoS Biol. 2013 Oct.

Abstract

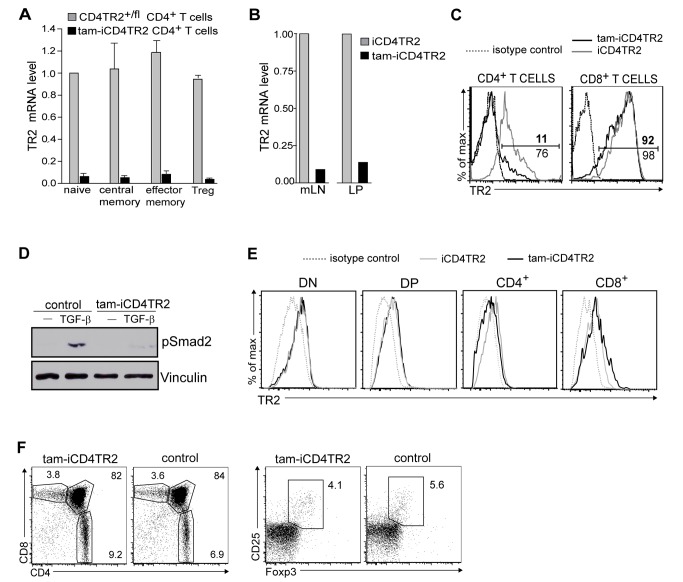
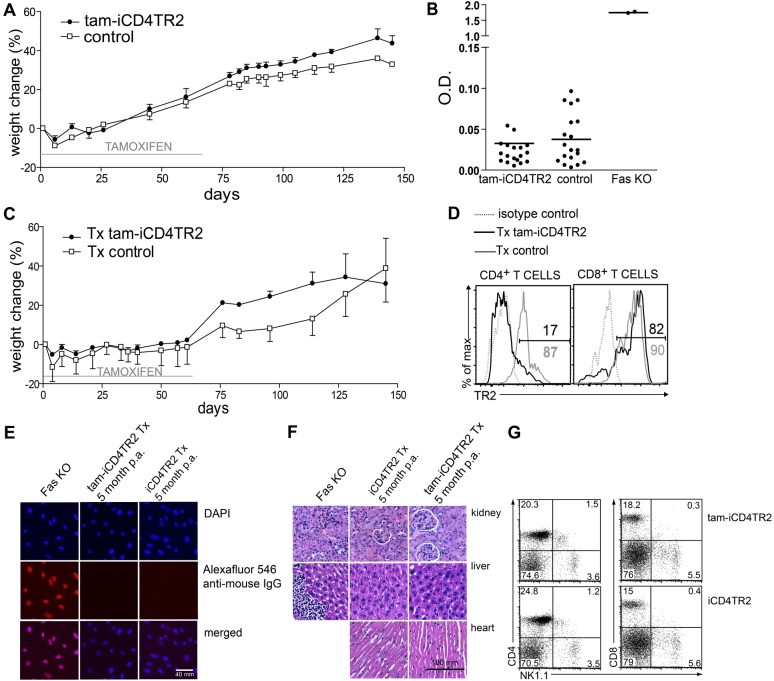
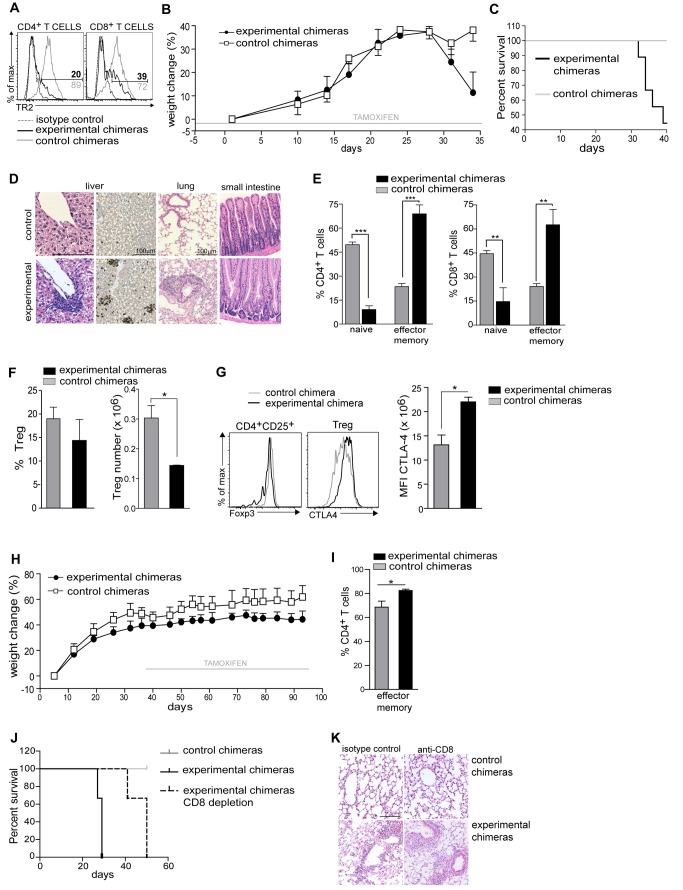
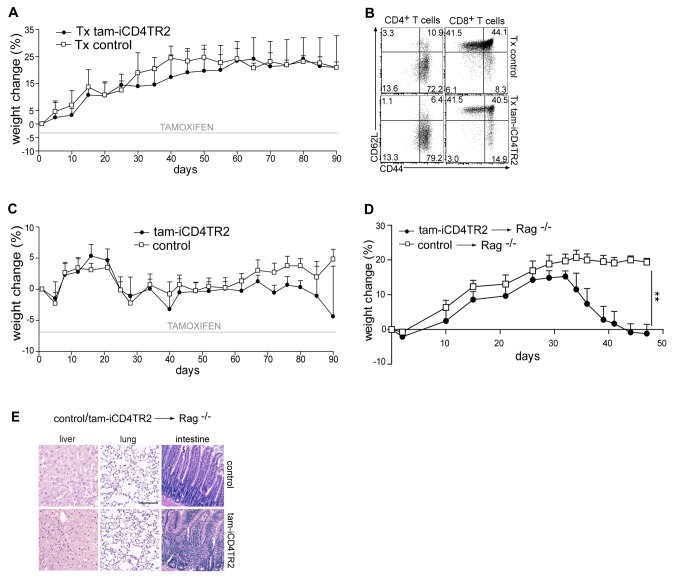
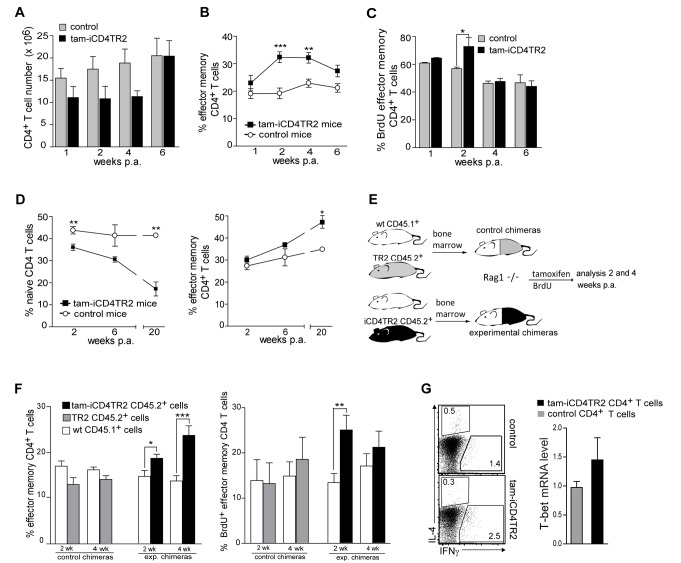
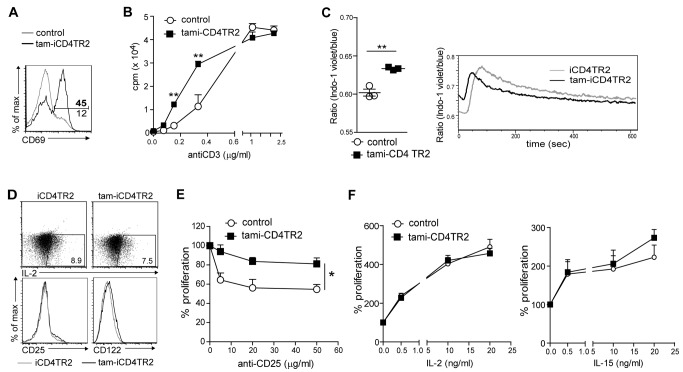
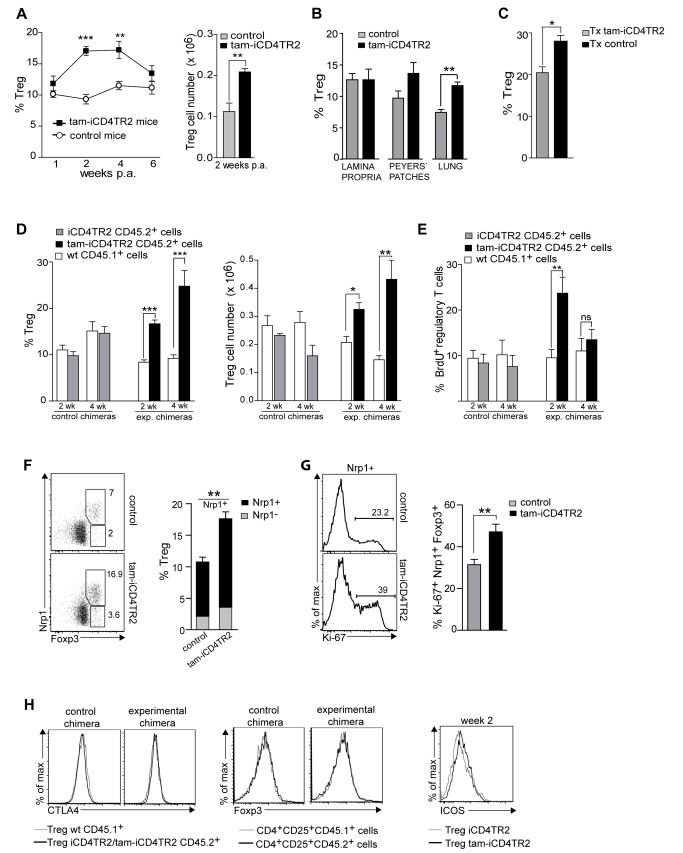
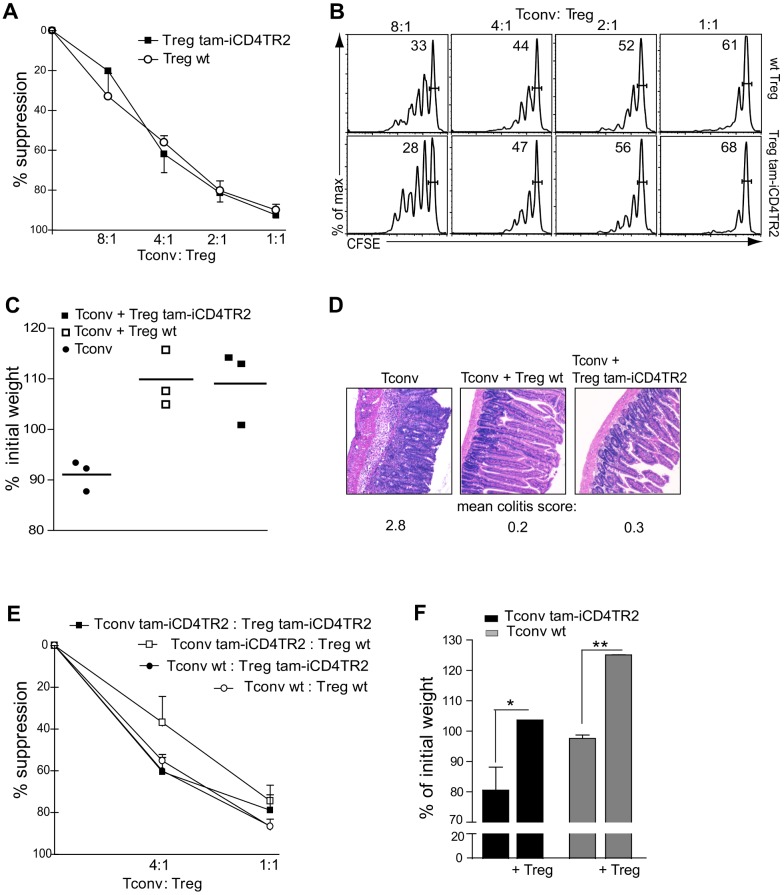
TGF-β is widely held to be critical for the maintenance and function of regulatory T (T(reg)) cells and thus peripheral tolerance. This is highlighted by constitutive ablation of TGF-β receptor (TR) during thymic development in mice, which leads to a lethal autoimmune syndrome. Here we describe that TGF-β-driven peripheral tolerance is not regulated by TGF-β signalling on mature CD4⁺ T cells. Inducible TR2 ablation specifically on CD4⁺ T cells did not result in a lethal autoinflammation. Transfer of these TR2-deficient CD4⁺ T cells to lymphopenic recipients resulted in colitis, but not overt autoimmunity. In contrast, thymic ablation of TR2 in combination with lymphopenia led to lethal multi-organ inflammation. Interestingly, deletion of TR2 on mature CD4⁺ T cells does not result in the collapse of the T(reg) cell population as observed in constitutive models. Instead, a pronounced enlargement of both regulatory and effector memory T cell pools was observed. This expansion is cell-intrinsic and seems to be caused by increased T cell receptor sensitivity independently of common gamma chain-dependent cytokine signals. The expression of Foxp3 and other regulatory T cells markers was not dependent on TGF-β signalling and the TR2-deficient T(reg) cells retained their suppressive function both in vitro and in vivo. In summary, absence of TGF-β signalling on mature CD4⁺ T cells is not responsible for breakdown of peripheral tolerance, but rather controls homeostasis of mature T cells in adult mice.


Conflict of interest statement

The authors have declared that no competing interests exist.

Figures

Figure 1
Figure 1. Validation of CD4-CreERt2/tamoxifen-mediated TR2 ablation.
(A) Quantitative RT-PCR of TR2 mRNA in FACS-sorted splenic CD4+ T cell subsets. These data are representative results of three independent experiments. (B) Quantitative RT-PCR of TR2 mRNA in FACS-sorted CD4+ T cells from mesenteric lymph nodes and lamina propria. These data are representative results of three independent experiments. (C) Flow cytometric analysis of TR2 expression by CD4+ and CD8+ T cells from peripheral blood. These data are representative results of four independent experiments. (D) Western blot analysis of pSmad2 and Vinculin in lysates of magnetically purified splenic CD4+ T cells from tam-iCD4TR2 and control mice 2 wk p.a.. The cells were cultured for 40 min in the presence of antiCD3/CD28 either with or without 20 ng/ml TGFβ-1. These are representative data of two independent experiments. (E) Flow cytometric analysis of TR2 expression by thymocytes 2 wk p.a. These data are representative results of two independent experiments. (F) Flow cytometric analysis of expression of CD4 and CD8 by thymocytes (left panel) as well as Foxp3 and CD25 by CD4+ SP thymocytes (right panel) from tam-iCD4TR2 and control mice at 2 wk p.a. These data are representative results of three independent experiments.
Figure 2
Figure 2. Absence of autoimmunity after TR2 ablation in mature CD4+ T cells.
(A) iCD4TR2 and control mice were treated with tamoxifen citrate for 2 mo followed by 3 mo on normal diet and body weight was monitored (mean ± SEM, 5 mice per group, representative data of two independent experiments). (B) ELISA for anti-dsDNA antibodies in sera from tam-iCD4TR2 and control mice 2, 4, 6 wk, and 5 month p.a.; as positive control a serum from a fas-deficient mouse was used. (C) iCD4TR2 and control mice were thymectomised 1 wk before the beginning of tamoxifen treatment and treated with tamoxifen citrate for 2 mo followed by 3 mo on normal diet and body weight was monitored (mean ± SEM, 5 mice per group, representative data of two independent experiments). (D) Flow cytometric analysis of TR2 expression by CD4+ and CD8+ T cells from peripheral blood after 5 mo postthymectomy and tamoxifen treatment. (E) Analysis of antinuclear antibodies by immunofluorescent staining of NIH3T3 cells with sera from indicated mice. Representative micrographs are shown. The size bar indicates 40 µm. (F) Representative micrographs of H&E-stained tissue sections of indicated organs isolated from thymectomised tam-iCD4TR2 or control mice from (C). The size bar indicates 100 µm. (G) Flow cytometric analysis of NK1.1 expression on splenic CD4+ and CD8+ T cells isolated from tam-iCD4TR2 or control mice 2 wk posttamoxifen administration. These are representative data of three independent experiments.
Figure 3
Figure 3. Development of lethal autoimmunity after thymic deletion of TR2.
Tamoxifen-treatment of Rag1−/− mice started 3 d before reconstitution with T-cell–depleted bone marrow from iCD4TR2 or control mice (A–G). (A) Flow cytometric analysis of TR2 expression by CD4+ and CD8+ T cells at day 34. Representative data of two independent experiments. (B) Body weight was monitored during the whole experiment (mean ± SEM, 5 mice per group, representative data of two independent experiments). (C) Kaplan-Meyer survival graph for all animals of experiments. (D) Representative micrographs of H&E- and anti-CD3-stained tissue sections of indicated organs at day 34. The size bar indicates 100 µm. (E) Flow cytometric analysis of the expression of CD44 and CD62l by CD4+ and CD8+ T cells. The percentage of Tn and Tem cells in the spleen of experimental and control chimeric mice (mean ± SEM, 6 mice per group, analysed in two independent experiments). (F) Percentage and number of splenic Treg cells at day 34 (mean ± SEM, 5 mice per group; representative data of two independent experiments). (G) Flow cytometric analysis of FoxP3 and CTLA-4 by indicated splenic CD4+ T cells subsets at day 34 (representative data of three independent experiments). Mean florescence intensity of CTLA-4 expression by splenic Treg cells (right panel, mean ± SEM, 4 mice per group; representative data of three independent experiments). (H) Rag1−/− mice were reconstituted with T-cell–depleted bone marrow from iCD4TR2 or control mice. Tamoxifen treatment of recipients started 5 wk postreconstitution and body weight was monitored during the whole experiment (mean ± SEM, 5 mice per group; representative data of two independent experiments). (I) The percentage of Tem, cells in the spleen of experimental and control chimeric mice (mean ± SEM, 6 mice per group, analysed in two independent experiments). (J) Tamoxifen-treatment of Rag1−/− mice started 3 d before reconstitution with T-cell–depleted bone marrow from iCD4TR2 or control mice. At day 15 posttransfer treatment with anti-CD8 antibody or isotype control started. Shown is a Kaplan-Meyer survival graph for all animals in the experiments (representative data of two independent experiments). (K) Representative micrographs of H&E-stained lung sections in the terminal stage of the disease. The size bar indicates 100 µm.
Figure 4
Figure 4. TR2-deficiency in CD4+ T cells in combination with severe lymphopenia leads to colitis.
(A) iCD4TR2 and control mice were thymectomised at the age of 7 wk, 1 wk before tamoxifen treatment started, and treated once (day 0) with anti-CD4 antibody. Body weight was monitored during whole period of experiment (mean ± SEM, 4 mice per group). (B) Flow cytometric analysis of CD44 and CD62l expression by splenic CD4+ and CD8+ T cells isolated at day 90 (experiment as in A). (C) iCD4TR2 and control mice were irradiated (550 rad) 5 d after starting tamoxifen treatment. Tamoxifen treatment was continued for 90 d. Body weight was monitored during the whole period of experiment (mean ± SEM, 4 mice per group). (D) Purified T cells isolated from tam-iCD4TR2 and control mice 2 wk p.a. were transferred to Rag−/− mice. Body weight was monitored during the whole period of the experiment (mean ± SEM, 5 mice per group). (E) Representative micrographs of H&E-stained tissue sections of indicated organs isolated from Rag−/− mice 7 wk after adoptive transfer of T cells. The size bar indicates 200 µm.
Figure 5
Figure 5. Increased proliferation of Tem cells upon removal of TR2.
(A) Absolute number of CD4+ T cells in spleens of tam-iCD4TR2 and control mice 1, 2, 4, and 6 wk p.a. Mice were treated with tamoxifen for 5 consecutive days (mean ± SEM, 9 mice per group, analysed in three independent experiments). (B) Percentage of Tem, cells in the spleen of tam-iCD4TR2, and control mice at indicated time points (percentage out of CD4+ T cell, mean ± SEM, 9 mice per group, analysed in three independent experiments). (C) The percentages of BrdU+ Tem cells isolated from spleens of tam-iCD4TR2 and control mice, gated on CD4+ T cells (mean ± SEM, 9 mice per group, analysed in three independent experiments). (D) The percentage of Tn and Tem cells in the spleen of thymectomised tam-iCD4TR2 and control mice at indicated time points (mean ± SEM, 9 mice per group, analysed in two independent experiments). (E) Rag1−/− mice were reconstituted with T-cell–depleted bone marrow from WT CD45.1+ and CD45.2+ iCD4TR2 or TR2 mice in 1∶1 ratio and treated with tamoxifen for 5 consecutive days 5 wk postreconstitution. Scheme of the experimental setup. (F) The percentage of CD4+ Tem of total CD4+ T cells from LNs are shown (left panel) and the percentage of BrdU+ Tem cells isolated from LNs (right panel) (mean ± SEM, 10 mice per group, analysed in three independent experiments). (G) Flow cytometric analysis of the expression of IFN-γ and IL-4 by splenic CD4+ T cells from tam-iCD4TR2 and control mice 2 wk p.a. (representative data of two independent experiments). Quantitative RT-PCR of T-bet mRNA in sorted splenic CD4+ T cell. These data are representative results of two independent experiments (right panel).
Figure 6
Figure 6. Deregulated proliferation control upon removal of TR2.
(A) Flow cytometric analysis of CD69 expression by CD4+ splenic T cells isolated 2 wk p.a. These data are representative results of three independent experiments. (B) Analysis of sensitivity to activation through measurement of proliferation. Sorted CD4+ T cells were cultured for 72 h and stimulated with different anti-CD3 concentrations. Thymidine was added for the last 24 h of culture (mean ± SEM, 4 mice per group, analysed in two independent experiments). (C) Flow cytometric analysis of cytoplasmic calcium by ratiometric measurement of Indo-1–labelled cells from tam-iCD4TR2 and control mice. TCR crosslinking was performed after 15 s. On the left mean ratio of the baseline (representative data of two independent experiments). (D) Flow cytometric analysis of IL-2, CD25, and CD122 expression by splenic CD4+ T cells isolated from tam-iCD4TR2 and control mice. These data are representative results of two independent experiments. (E and F) Proliferation analysis of sorted CD4+ T cells cultured for 72 h with anti-CD3 (0.6 µg/ml) and anti-CD25 (PC61) (E) or indicated cytokines (F). Thymidine was added for the last 24 h of culture (mean ± SEM, 4 mice per group, analysed in two independent experiments).
Figure 7
Figure 7. Increased proliferation of regulatory T cells upon removal of TR2.
(A) The percentage of Treg cells (left panel) and number of Treg cells (right panel) in the spleen of tam-iCD4TR2 and control mice at indicated time points (mean ± SEM, 9 mice per group, analysed in two independent experiments). (B) The percentage of Treg cells in the indicated organs of tam-iCD4TR2 and control mice (mean ± SEM, 5 mice per group, analysed in two independent experiments). (C) The percentage of Treg cells in the spleens of thymectomised tam-iCD4TR2 and control mice 20 wk p.a. (mean ± SEM, 9 mice per group, analysed in two independent experiments). (D) The percentage of Treg (left panel) and absolute number of Treg cells (right panel) within the LN CD4+ T cells of the indicated CD45.1+ or CD45.2+ bone marrow–derived cells (experiment described in Figure 5E, mean ± SEM, 10 mice per group, analysed in three independent experiments). (E) The percentage of BrdU+ Treg cells isolated from LN (experiment described in Figure 5E, mean ± SEM, 10 mice per group, analysed in three independent experiments). (F) Flow cytometric analysis of Nrp-1 and Foxp3 expression by CD4+ T cells (left panel) and the percentage of Nrp-1+ and Nrp-1 Treg cells within the LN CD4+ T cells of tam-iCD4TR2 and control mice 2 wk p.a. (right panel) (mean ± SEM, 9 mice per group, analysed in two independent experiments). (G) Flow cytometric analysis of Ki-67 expression by Nrp-1+ Treg cells (left panel) and the percentage of Ki-67+Nrp-1+ Treg cells within the LN CD4+ T cells of tam-iCD4TR2 and control mice 2 wk p.a. (right panel) (mean ± SEM, 9 mice per group, analysed in two independent experiments). (H) Flow cytometric analysis of the expression of CTLA4 by Treg and Foxp3 by CD4+CD25+ T cells isolated from spleen of mixed bone marrow chimeras. These data are representative results of three independent experiments (left panel). Flow cytometric analysis of the expression of ICOS by splenic Treg cells from tam-iCD4TR2 and control mice at indicated time point p.a. Representative data of three independent experiments.
Figure 8
Figure 8. Treg cells lacking TR2 are functional.
(A) In vitro suppression assay: sorted conventional CD45.1+CD4+ T cells were stimulated with anti-CD3 (2 µg/ml) and cocultured with sorted WT Treg cells or tam-iCD4TR2 Treg cells (isolated 14 d p.a.) at various ratios. Thymidine was added for the last 24 h of culture. Analysis was performed after 96 h. Percent suppression as mean ± SD (analysed in two independent experiments). (B) In vitro suppression assay: sorted conventional CD45.1+CD4+ T cells were labelled with CFSE, stimulated with anti-CD3 (2 µg/ml), and cocultured with sorted wt Treg cells or tam-iCD4TR2 Treg cells (isolated 14 d p.a.) at various ratios. FACS analysis was performed after 96 h. These data are representative results of two independent experiments. (C and D) In vivo suppression assay: Development of colitis in Rag1−/− mice after transfer of conventional CD4+ T cells alone or in combination with tam-iCD4TR2 (mice treated for 5 d, cells isolated 1 wk p.a.) Treg cells or iCD4TR2 Treg cells. Change in body weight after 8 wk posttransfer (mean, 3 mice per group, representative data of two independent experiments). (D) Representative micrographs of H&E-stained small intestine sections from in vivo suppression experiments isolated from Rag1−/− mice 8 wk after transfer of the indicated cells. Scoring of colitis severity according to . (E) Criss-cross in vitro suppression assay: sorted conventional tam-iCD4TR2 and WT T cells were cocultured with sorted tam-iCD4TR2 and wt Treg cells at various ratios. Analysis was performed after 96 h (representative data of two independent experiments). (F) Development of colitis in Rag1−/− mice after adoptive transfer of conventional tam-iCD4TR2 and wt T cells alone or in combination with tam-iCD4TR2 Treg cells. Change in body weight after 8 wk posttransfer (mean ± SEM, 3 mice per group, representative data of two independent experiments).

Similar articles

Cited by

References

    1. Kehrl JH, Wakefield LM, Roberts AB, Jakowlew S, Alvarez-Mon M, et al. (1986) Production of transforming growth factor beta by human T lymphocytes and its potential role in the regulation of T cell growth. J Exp Med 163: 1037–1050. - PMC - PubMed
    1. Kulkarni AB, Huh CG, Becker D, Geiser A, Lyght M, et al. (1993) Transforming growth factor beta 1 null mutation in mice causes excessive inflammatory response and early death. Proc Natl Acad Sci U S A 90: 770–774. - PMC - PubMed
    1. Oshima M, Oshima H, Taketo MM (1996) TGF-beta receptor type II deficiency results in defects of yolk sac hematopoiesis and vasculogenesis. Dev Biol 179: 297–302. - PubMed
    1. Larsson J, Goumans MJ, Sjostrand LJ, van Rooijen MA, Ward D, et al. (2001) Abnormal angiogenesis but intact hematopoietic potential in TGF-beta type I receptor-deficient mice. EMBO J 20: 1663–1673. - PMC - PubMed
    1. Gorelik L, Flavell RA (2000) Abrogation of TGFbeta signaling in T cells leads to spontaneous T cell differentiation and autoimmune disease. Immunity 12: 171–181. - PubMed

Publication types

MeSH terms

Grants and funding

This work was supported by the DFG grants BU 1410/1-1 and BU 1410/1-2, the Swiss National Science Foundation grant 0310030-116201, a grant by the Hartmann-Müller Stiftung, and a fellowship of Nordrhein-Westfalen to TB, SFB/TR 52 TPC2 for AW. The funders had no role in study design, data collection and analysis, decision to publish, or preparation of the manuscript.