

Silencing of GLS and overexpression of GLS2 genes cooperate in decreasing the proliferation and viability of glioblastoma cells
- PMID: 24096582
- PMCID: PMC3967065
- DOI: 10.1007/s13277-013-1247-4
Silencing of GLS and overexpression of GLS2 genes cooperate in decreasing the proliferation and viability of glioblastoma cells
Abstract
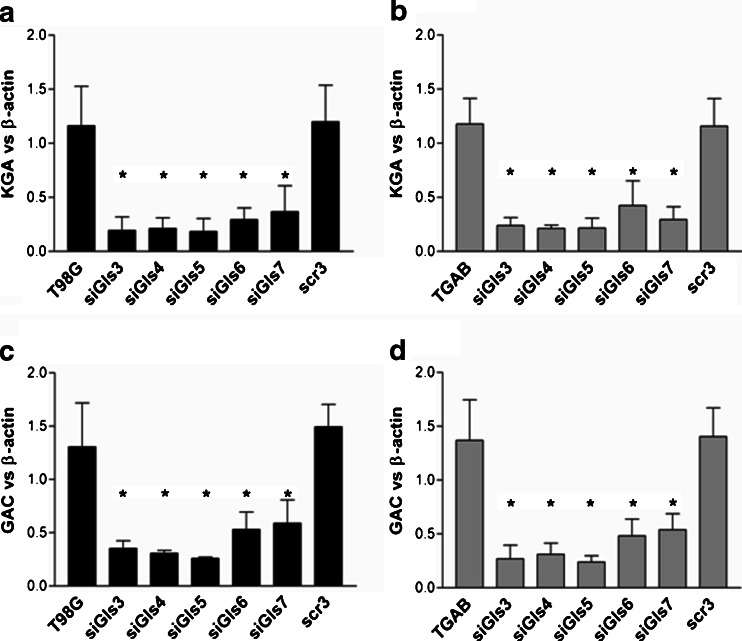
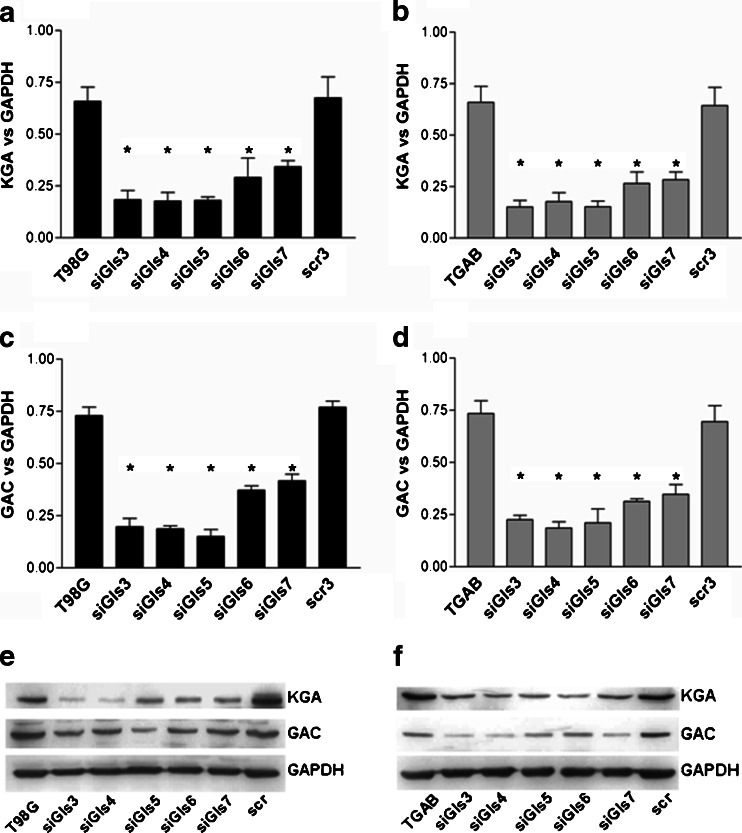
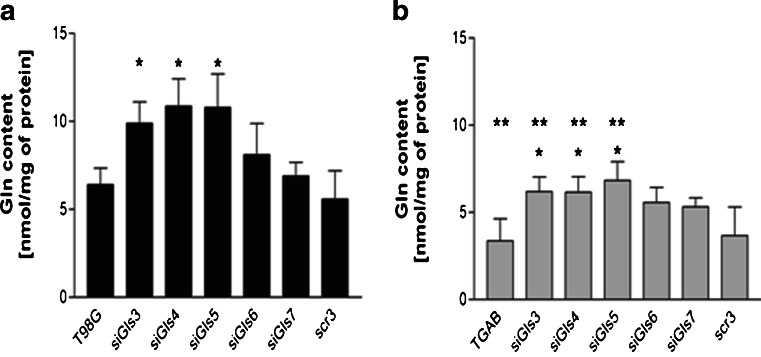
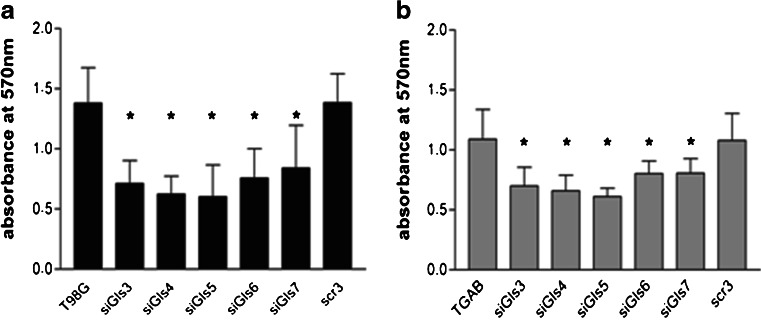
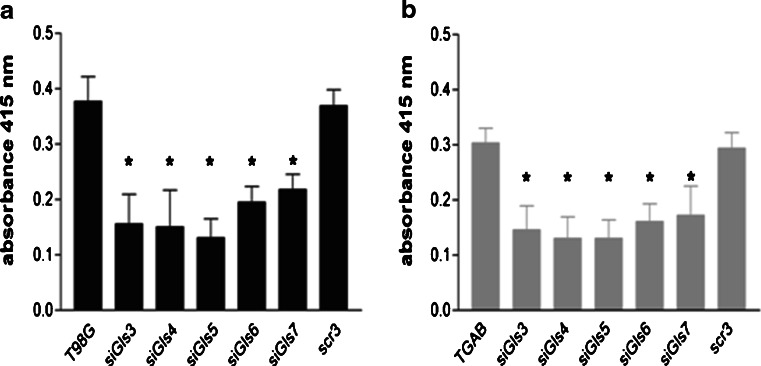
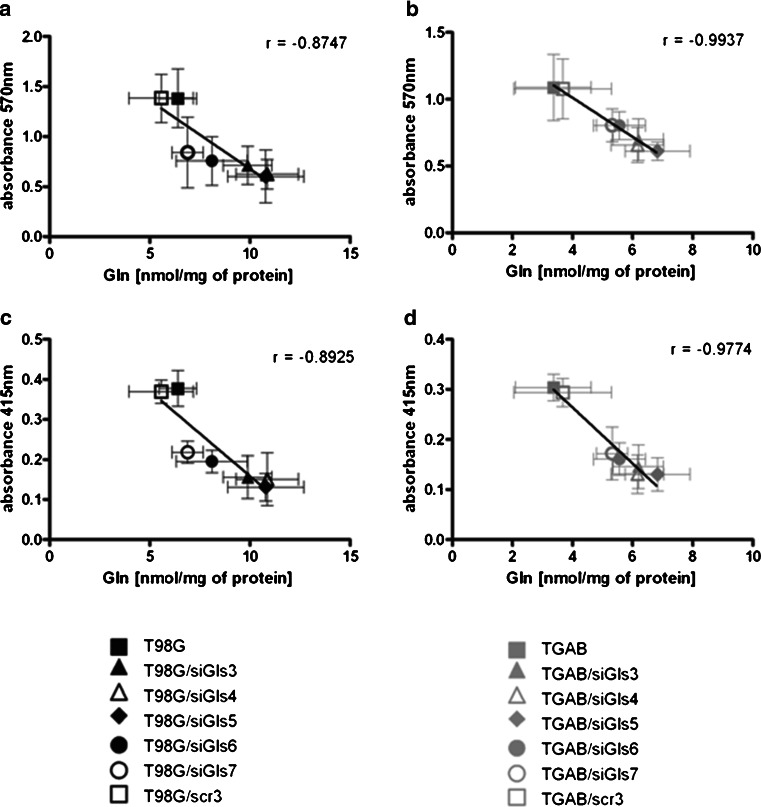
Glutamine (Gln) metabolism, initiated by its degradation by glutaminases (GA), is elevated in neoplastic cells and tissues. In malignant glia-derived tumors, GA isoforms, KGA and GAC, coded by the GLS gene, are overexpressed, whereas the GLS2-coded GAB and LGA isoforms, are hardly detectable in there. Our previous study revealed that transfection of T98G glioblastoma cells with GAB reduced cell proliferation and migration, by a yet unknown mechanism not related to Gln degradation. The question arose how simultaneous overexpression of GAB and inhibition of KGA would affect glioblastoma cell growth. Here, we used siRNA to silence the expression of Gls in T98G cells which were or were not stably transfected with GAB (TGAB cells). In both T98G and TGAB cell lines, silencing of Gls with siRNAs targeted at different sequences decreased cell viability and proliferation in a different, sequence-dependent degree, and the observed decreases were in either cell line highly correlated with increase of intracellular Gln (r > 0.9), a parameter manifesting decreased Gln degradation. The results show that combination of negative modulation of GA isoforms arising from GLS gene with the introduction of the GLS2 gene product, GAB, may in the future provide a useful means to curb glioblastoma growth in situ. At the same time, the results underscore the critical role of Gln degradation mediated by KGA in the manifestations of aggressive glial tumor phenotype.
Figures
Similar articles
-
Opposing roles of glutaminase isoforms in determining glioblastoma cell phenotype.Neurochem Int. 2015 Sep;88:6-9. doi: 10.1016/j.neuint.2014.11.004. Epub 2014 Dec 18. Neurochem Int. 2015. PMID: 25529918 Review.
-
Glutaminase isoforms expression switches microRNA levels and oxidative status in glioblastoma cells.J Biomed Sci. 2021 Feb 20;28(1):14. doi: 10.1186/s12929-021-00712-y. J Biomed Sci. 2021. PMID: 33610185 Free PMC article.
-
Both GLS silencing and GLS2 overexpression synergize with oxidative stress against proliferation of glioma cells.J Mol Med (Berl). 2014 Mar;92(3):277-90. doi: 10.1007/s00109-013-1105-2. Epub 2013 Nov 26. J Mol Med (Berl). 2014. PMID: 24276018 Free PMC article.
-
Glutaminases in slowly proliferating gastroenteropancreatic neuroendocrine neoplasms/tumors (GEP-NETs): Selective overexpression of mRNA coding for the KGA isoform.Exp Mol Pathol. 2016 Feb;100(1):74-8. doi: 10.1016/j.yexmp.2015.11.017. Epub 2015 Nov 12. Exp Mol Pathol. 2016. PMID: 26581715
-
Glutaminases in brain: Multiple isoforms for many purposes.Neurochem Int. 2015 Sep;88:1-5. doi: 10.1016/j.neuint.2015.03.006. Epub 2015 Mar 30. Neurochem Int. 2015. PMID: 25837287 Review.
Cited by
-
Combined blockade of EGFR and glutamine metabolism in preclinical models of colorectal cancer.Transl Oncol. 2020 Oct;13(10):100828. doi: 10.1016/j.tranon.2020.100828. Epub 2020 Jul 8. Transl Oncol. 2020. PMID: 32652471 Free PMC article.
-
Metformin and temozolomide, a synergic option to overcome resistance in glioblastoma multiforme models.Oncotarget. 2017 Dec 6;8(68):113090-113104. doi: 10.18632/oncotarget.23028. eCollection 2017 Dec 22. Oncotarget. 2017. PMID: 29348889 Free PMC article.
-
The Biological and Clinical Significance of Glutaminase in Luminal Breast Cancer.Cancers (Basel). 2021 Aug 6;13(16):3963. doi: 10.3390/cancers13163963. Cancers (Basel). 2021. PMID: 34439127 Free PMC article.
-
Disrupted glutamate homeostasis as a target for glioma therapy.Pharmacol Rep. 2024 Dec;76(6):1305-1317. doi: 10.1007/s43440-024-00644-y. Epub 2024 Sep 11. Pharmacol Rep. 2024. PMID: 39259492 Free PMC article. Review.
-
FAIM regulates autophagy through glutaminolysis in lung adenocarcinoma.Autophagy. 2022 Jun;18(6):1416-1432. doi: 10.1080/15548627.2021.1987672. Epub 2021 Oct 31. Autophagy. 2022. PMID: 34720024 Free PMC article.
References
-
- Elgadi KM, Meguid RA, Qian M, Souba WW, Abcouwer SF. Cloning and analysis of unique human glutaminase isoforms generated by tissue-specific alternative splicing. Physiol Genomics. 1999;1:51–62. - PubMed
Publication types
MeSH terms
Substances
LinkOut - more resources
Full Text Sources
Other Literature Sources
Miscellaneous
