

Novel methylation biomarker panel for the early detection of pancreatic cancer
- PMID: 24088737
- PMCID: PMC4310572
- DOI: 10.1158/1078-0432.CCR-12-3224
Novel methylation biomarker panel for the early detection of pancreatic cancer
Abstract
Purpose: Pancreatic cancer is the fourth leading cause of cancer deaths and there currently is no reliable modality for the early detection of this disease. Here, we identify cancer-specific promoter DNA methylation of BNC1 and ADAMTS1 as a promising biomarker detection strategy meriting investigation in pancreatic cancer.
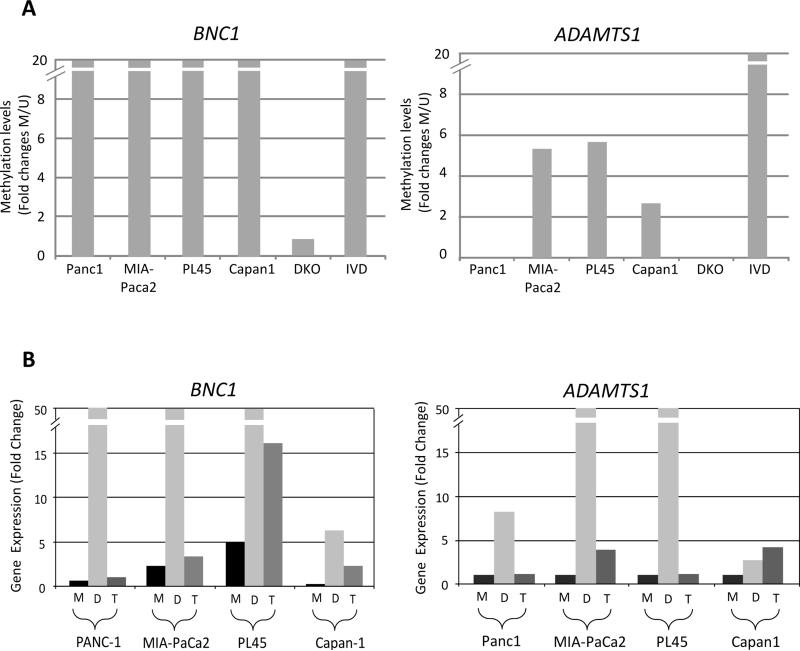
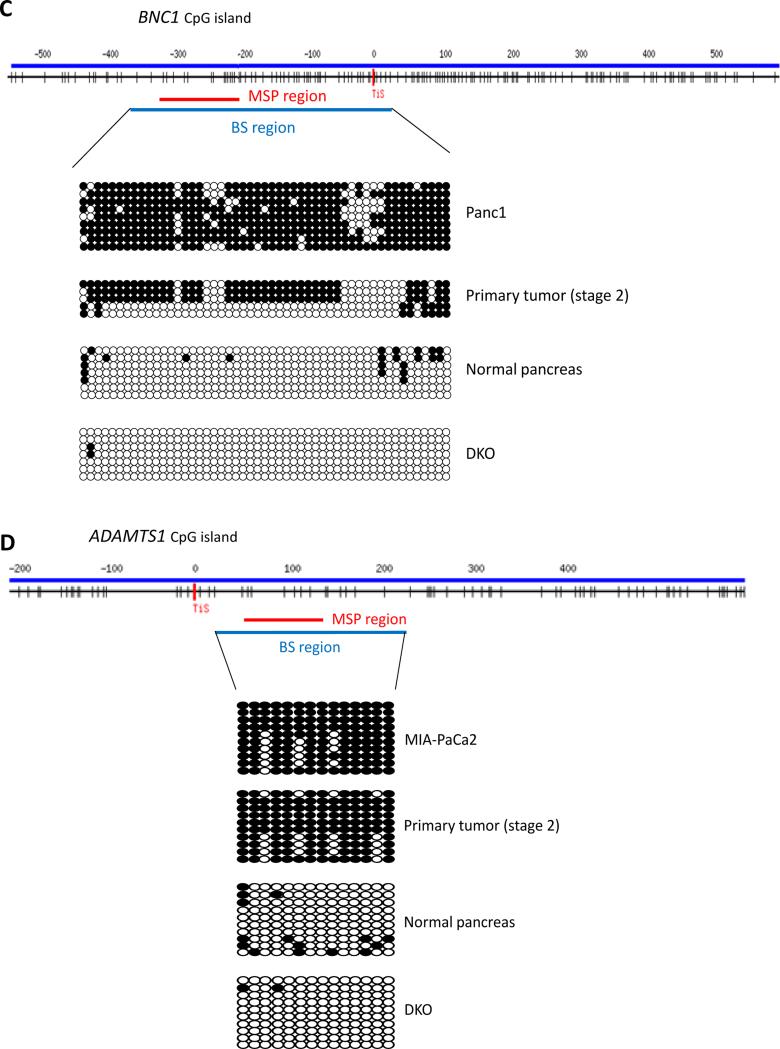
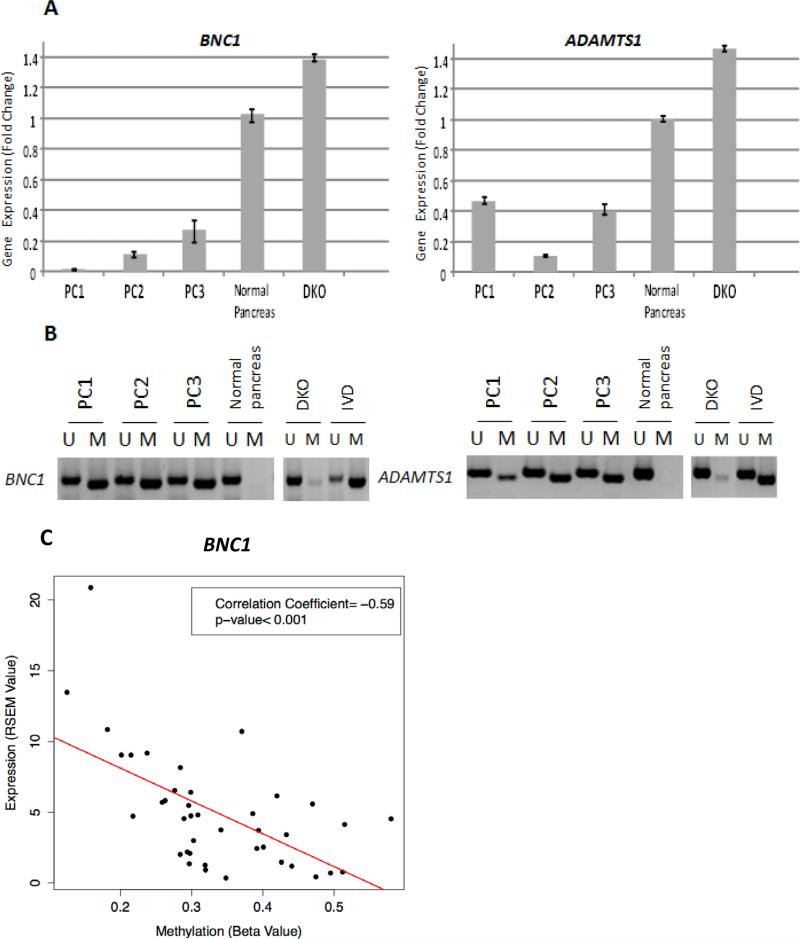
Experimental design: We used a genome-wide pharmacologic transcriptome approach to identify novel cancer-specific DNA methylation alterations in pancreatic cancer cell lines. Of eight promising genes, we focused our studies on BNC1 and ADAMTS1 for further downstream analysis, including methylation and expression. We used a nanoparticle-enabled methylation on beads (MOB) technology to detect early-stage pancreatic cancers by analyzing DNA methylation in patient serum.
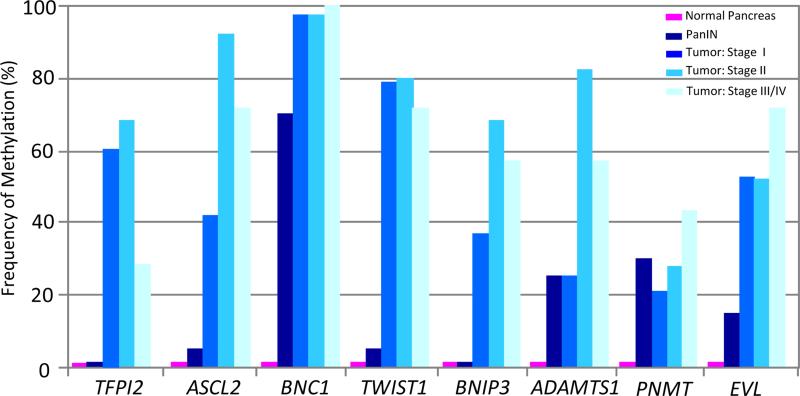
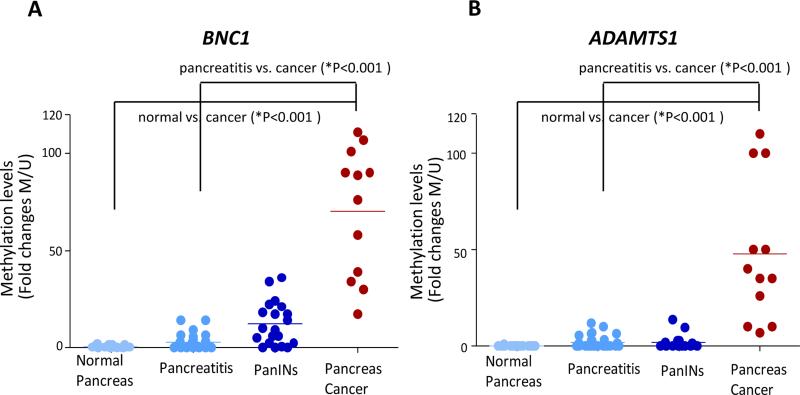
Results: We identified two novel genes, BNC1 (92%) and ADAMTS1 (68%), that showed a high frequency of methylation in pancreatic cancers (n = 143), up to 100% in PanIN-3 and 97% in stage I invasive cancers. Using the nanoparticle-enabled MOB technology, these alterations could be detected in serum samples (n = 42) from patients with pancreatic cancer, with a sensitivity for BNC1 of 79% [95% confidence interval (CI), 66%-91%] and for ADAMTS1 of 48% (95% CI, 33%-63%), whereas specificity was 89% for BNC1 (95% CI, 76%-100%) and 92% for ADAMTS1 (95% CI, 82%-100%). Overall sensitivity using both markers is 81% (95% CI, 69%-93%) and specificity is 85% (95% CI, 71%-99%).
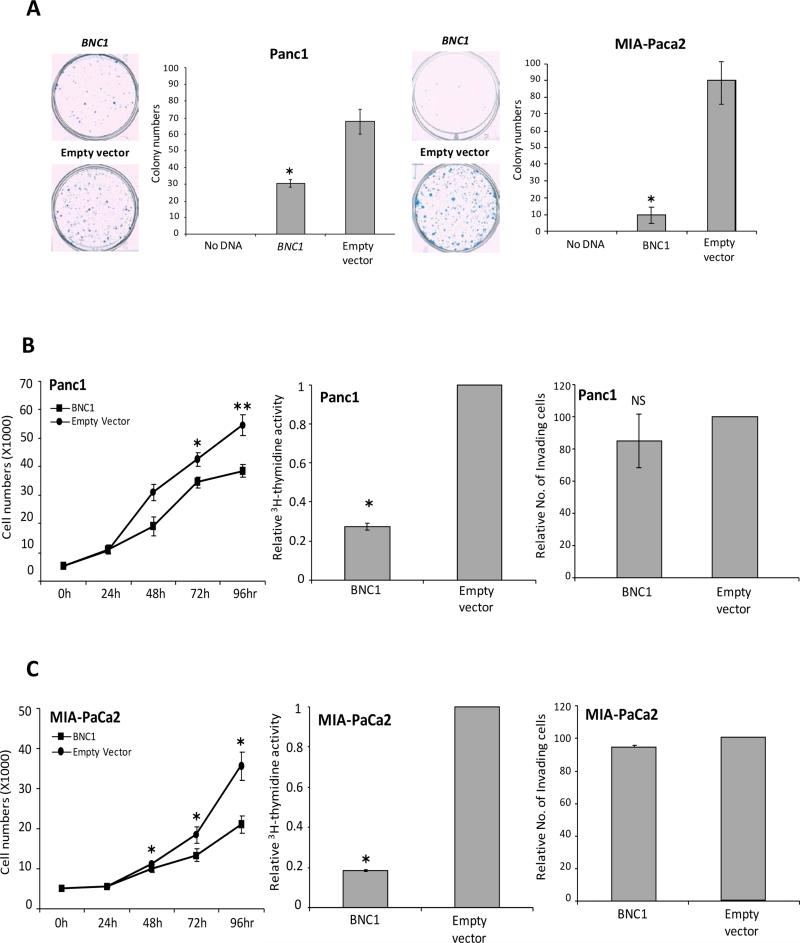
Conclusions: Promoter DNA methylation of BNC1 and ADAMTS1 is a potential biomarker to detect early-stage pancreatic cancers. Assaying the promoter methylation status of these genes in circulating DNA from serum is a promising strategy for early detection of pancreatic cancer and has the potential to improve mortality from this disease.
©2013 AACR.
Figures
Similar articles
-
Promoter methylation of ADAMTS1 and BNC1 as potential biomarkers for early detection of pancreatic cancer in blood.Clin Epigenetics. 2019 Apr 5;11(1):59. doi: 10.1186/s13148-019-0650-0. Clin Epigenetics. 2019. PMID: 30953539 Free PMC article.
-
Methylation-based Cell-free DNA Signature for Early Detection of Pancreatic Cancer.Pancreas. 2021 Oct 1;50(9):1267-1273. doi: 10.1097/MPA.0000000000001919. Pancreas. 2021. PMID: 34860810
-
Utility of promoter hypermethylation in malignant risk stratification of intraductal papillary mucinous neoplasms.Clin Epigenetics. 2023 Feb 20;15(1):28. doi: 10.1186/s13148-023-01429-5. Clin Epigenetics. 2023. PMID: 36803844 Free PMC article.
-
Cell-Free DNA Methylation: The New Frontiers of Pancreatic Cancer Biomarkers' Discovery.Genes (Basel). 2019 Dec 23;11(1):14. doi: 10.3390/genes11010014. Genes (Basel). 2019. PMID: 31877923 Free PMC article. Review.
-
Early Epigenetic Markers for Precision Medicine.Methods Mol Biol. 2018;1856:3-17. doi: 10.1007/978-1-4939-8751-1_1. Methods Mol Biol. 2018. PMID: 30178243 Review.
Cited by
-
The GALNT9, BNC1 and CCDC8 genes are frequently epigenetically dysregulated in breast tumours that metastasise to the brain.Clin Epigenetics. 2015 May 27;7(1):57. doi: 10.1186/s13148-015-0089-x. eCollection 2015. Clin Epigenetics. 2015. PMID: 26052355 Free PMC article.
-
Circulating tumor cells: from new biological insights to clinical practice.Signal Transduct Target Ther. 2024 Sep 2;9(1):226. doi: 10.1038/s41392-024-01938-6. Signal Transduct Target Ther. 2024. PMID: 39218931 Free PMC article. Review.
-
The Methylation Status of the Epigenome: Its Emerging Role in the Regulation of Tumor Angiogenesis and Tumor Growth, and Potential for Drug Targeting.Cancers (Basel). 2018 Aug 10;10(8):268. doi: 10.3390/cancers10080268. Cancers (Basel). 2018. PMID: 30103412 Free PMC article. Review.
-
The Emerging Roles of ATP-Dependent Chromatin Remodeling Complexes in Pancreatic Cancer.Cancers (Basel). 2019 Nov 25;11(12):1859. doi: 10.3390/cancers11121859. Cancers (Basel). 2019. PMID: 31769422 Free PMC article. Review.
-
Circulating NPTX2 methylation as a non-invasive biomarker for prognosis and monitoring of metastatic pancreatic cancer.Clin Epigenetics. 2023 Jul 22;15(1):118. doi: 10.1186/s13148-023-01535-4. Clin Epigenetics. 2023. PMID: 37481552 Free PMC article.
References
-
- Jemal ASR, Ward E, Hao Y, Xu J, Thun MJ. Cancer statistics, 2009. CA Cancer J Clin. 2009;59:225–49. - PubMed
-
- Klapman J MM. Early detection of pancreatic cancer: why, who, and how to screen. Cancer Control. 2008;15:280–7. - PubMed
-
- Siegel RWE, Brawley O, Jemal A. Cancer statistics, 2011: the impact of eliminating socioeconomic and racial disparities on premature cancer deaths. A Cancer Journal for Clinicians. 2011;61:212–36. - PubMed
-
- Gemmel CEA, Helmstädter L, Riemann JF. Pancreatic cancer screening: state of the art. Expert Rev Gastroenterol Hepatol. 2009;3:89–96. - PubMed
Publication types
MeSH terms
Substances
Grants and funding
- CA058184/CA/NCI NIH HHS/United States
- F32 CA069731/CA/NCI NIH HHS/United States
- P50 CA058184/CA/NCI NIH HHS/United States
- U54 CA151838/CA/NCI NIH HHS/United States
- U54CA151838/CA/NCI NIH HHS/United States
- NIH NCI K23CA127141/CA/NCI NIH HHS/United States
- R01 CA155305/CA/NCI NIH HHS/United States
- R01CA155305/CA/NCI NIH HHS/United States
- P30CA006973/CA/NCI NIH HHS/United States
- NIEHS R01ES011858/ES/NIEHS NIH HHS/United States
- P30 CA006973/CA/NCI NIH HHS/United States
- T32CA126607/CA/NCI NIH HHS/United States
- K23 CA127141/CA/NCI NIH HHS/United States
- R01 ES011858/ES/NIEHS NIH HHS/United States
- T32 CA126607/CA/NCI NIH HHS/United States
LinkOut - more resources
Full Text Sources
Other Literature Sources
Medical
Miscellaneous
