. 2014 Jan;42(1):430-41.
doi: 10.1093/nar/gkt862. Epub 2013 Sep 27.

Covariation between homeodomain transcription factors and the shape of their DNA binding sites

Affiliations

Covariation between homeodomain transcription factors and the shape of their DNA binding sites

Iris Dror et al. Nucleic Acids Res. 2014 Jan.

Abstract

Protein-DNA recognition is a critical component of gene regulatory processes but the underlying molecular mechanisms are not yet completely understood. Whereas the DNA binding preferences of transcription factors (TFs) are commonly described using nucleotide sequences, the 3D DNA structure is recognized by proteins and is crucial for achieving binding specificity. However, the ability to analyze DNA shape in a high-throughput manner made it only recently feasible to integrate structural information into studies of protein-DNA binding. Here we focused on the homeodomain family of TFs and analyzed the DNA shape of thousands of their DNA binding sites, investigating the covariation between the protein sequence and the sequence and shape of their DNA targets. We found distinct homeodomain regions that were more correlated with either the nucleotide sequence or the DNA shape of their preferred binding sites, demonstrating different readout mechanisms through which homeodomains attain DNA binding specificity. We identified specific homeodomain residues that likely play key roles in DNA recognition via shape readout. Finally, we showed that adding DNA shape information when characterizing binding sites improved the prediction accuracy of homeodomain binding specificities. Taken together, our findings indicate that DNA shape information can generally provide new mechanistic insights into TF binding.


Figures

Figure 1.
Figure 1.
Flowchart for uncovering correlations between the amino acid sequences of homeodomains (HDs) and the nucleotide sequences and structural features of their DNA binding sites (BSs). (A) Based on the sequence alignment of HDs from mouse and Drosophila, we calculated two pair-wise similarity scores: one representing the similarity between HD sequences (‘Pair-wise HD sequence similarity’; gray) and another representing the similarity between the nucleotide sequences (shown as PWMs in standardized color code) of their DNA binding sites (‘Pair-wise DNA sequence similarity’; blue). We compared the two similarity scores using PCC. (B) Based on the sequence alignment of HDs from mouse and Drosophila and structural features of their DNA binding sites, we calculated five pair-wise similarity scores, one representing the similarity between the HD sequences (‘Pair-wise HD sequence similarity’; gray) and four representing the similarities between DNA shape parameters (MGW, ProT, Roll and HelT) of their DNA binding sites (‘Pair-wise DNA shape similarity’; purple). We compared each set of two similarity scores using PCC.
Figure 2.
Figure 2.
Correlation between homeodomain sequences and the DNA sequences and shapes of their binding sites. (A) PCC between pair-wise HD sequence similarity and pair-wise DNA sequence and shape similarity are shown for HDs in mouse derived from PBM data (14). (B) Co-crystal structure of engrailed HD in complex with DNA (PDB ID 3HDD) (29). Purple represents the N-terminal tail, and blue highlights the recognition helix. (C) PCCs for the comparison of pair-wise HD sequence similarity scores, using only the sequence of the N-terminal tail (purple) or the recognition helix (blue), with pair-wise DNA sequence and shape similarity scores. PBM data for 168 mouse HDs (14) were used in this analysis.
Figure 3.
Figure 3.
Dependencies between N-terminal tail residues (amino acid positions 1–9) and MGW of the DNA binding sites based on PBM data. (A) A heat map (blue) shows −log of the P-values of hypergeometric scores between positively charged amino acids (highlighted in blue) and narrow minor groove regions at each position of the HD-DNA binding sites derived from PBM data for 168 mouse HDs (14). Sequence logos representing the alignment of these 168 HD sequences are shown above. Basic amino acids in the logos are highlighted in blue. Numbering of the amino acid positions corresponds to the convention for Hoxa9 in mouse (32). (B) For the three HD positions with the highest hypergeometric scores (residues 2, 3 and 5), the average MGW for the DNA binding sites of all HDs with arginine (blue), lysine (cyan), histidine (purple) and non-positively charged amino acids (black) is plotted. Asterisks (color code referring to amino acid type) indicate nucleotide positions with significant differences in MGW (Wilcoxon P < 5 × 10⁻⁵). (C) A heat map (maroon) shows MI scores between each amino acid position in the HDs and MGW at each nucleotide position of their preferred DNA binding sites for the PBM data from mouse (14). Sequence logos representing the alignment of all 168 homeodomain sequences in mouse are shown above. Numbering of the amino acids corresponds with the convention for Hoxa9 in mouse. (D) For the three positions with the highest MI scores (residues 4, 6 and 7), the average MGW for the binding sites of all HDs with arginine (blue), lysine (cyan), histidine (purple) and non-positively charged amino acids (black) is plotted. Asterisks (color code referring to amino acid type) indicate nucleotide positions with significant differences in MGW (Wilcoxon P < 5 × 10⁻⁵).
Figure 4.
Figure 4.
Homeodomain–DNA shape recognition code. (A) We defined a DNA shape recognition code based on interactions between amino acids in the N-terminal tail (top) (HD positions 2–6) and the preferred MGW at each position of the DNA binding site (bottom). The average MGW of all homeodomains in mouse is plotted along the logo representing the combined DNA sequence and shape preference of all homeodomains [using the mouse PBM data (14)]. Nucleotide pairs (red) represent regions of the narrow minor groove. A diagonal line over the amino acid labels at positions 4 and 6 indicates amino acids that are correlated with a wider minor groove. (B) Co-crystal structure of MATα2 in complex with MATa1 and DNA (PDB ID 1YRN) (30). Shown here are residues 2–6 of the N-terminal tail with amino acids at positions 2 and 5 (blue) engaged in physical interactions with DNA. Nucleotide pairs 1, 4 and 5 (red) represent regions with a narrow minor groove. (C) Co-crystal structure of Sex combs reduced (Scr) in complex with Exd and DNA (PDB ID 2R5Z) (4). Shown here are N-terminal tail residues at positions 3–6 with amino acids 3 and 5 (blue) engaged in physical interactions with DNA. Nucleotide pairs 1, 4 and 5 (red) represent regions with a narrow minor groove.
Figure 5.
Figure 5.
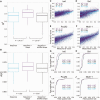
Prediction of PBM binding affinity based on a combination of DNA sequence and shape compared with DNA sequence alone. MLR was used to predict the binding affinity of each 8-mer, using the nucleotide sequences of the 8-mers (blue), the sequence and four DNA shape parameters of the 8-mers (purple) and the sequence and shuffle of the four DNA shape parameters of the 8-mers (black). (A) Box plots representing the distribution of R2 for all 168 homeodomains in mouse in the PBM data set (14). Wilcoxon P-values between the models indicate the significant contribution of DNA shape features. Boxes represent the median (line inside the box), 25th and 75th percentiles (edges of the box) and 5th and 95th percentiles (whiskers). (B) Box plots representing the distribution of the AUC values for all 168 homeodomains in mouse in the PBM data set (14). Wilcoxon P-values between the models indicate the significant contribution of DNA shape features. The boxes represent the median (line inside the box), 25th and 75th percentiles (edges of the box) and 5th and 95th percentiles (whiskers). (C–F) Correlations between experimental and predicted binding affinities for each 8-mer for the homeodomains Irx6, Six1, Pou2f2 and Nkx6-1. (G–J) ROC curves analyzing binding affinity prediction accuracies for Irx6, Six1, Pou2f2 and Nkx6-1.

Similar articles

Cited by

References

    1. Seeman NC, Rosenberg JM, Rich A. Sequence-specific recognition of double helical nucleic acids by proteins. Proc. Natl Acad. Sci. USA. 1976;73:804–808. - PMC - PubMed
    1. Rohs R, Jin X, West SM, Joshi R, Honig B, Mann RS. Origins of specificity in protein-DNA recognition. Annu. Rev. Biochem. 2010;79:233–269. - PMC - PubMed
    1. Harris RC, Mackoy T, Dantas Machado AC, Xu D, Rohs R, Fenley MO. Chapter 3, vol. II In: T. Schlick (ed). Innovations in Biomolecular Modeling and Simulations. 2012. Opposites attract: shape and electrostatic complementarity in protein-DNA complexes. 53–80. The Royal Society of Chemistry. Cambridge, UK.
    1. Joshi R, Passner JM, Rohs R, Jain R, Sosinsky A, Crickmore MA, Jacob V, Aggarwal AK, Honig B, Mann RS. Functional specificity of a Hox protein mediated by the recognition of minor groove structure. Cell. 2007;131:530–543. - PMC - PubMed
    1. Kitayner M, Rozenberg H, Rohs R, Suad O, Rabinovich D, Honig B, Shakked Z. Diversity in DNA recognition by p53 revealed by crystal structures with Hoogsteen base pairs. Nat. Struct. Mol. Biol. 2010;17:423–429. - PMC - PubMed

Publication types

LinkOut - more resources