

Altered epigenetic regulation of homeobox genes in human oral squamous cell carcinoma cells
- PMID: 24076275
- PMCID: PMC3880227
- DOI: 10.1016/j.yexcr.2013.09.011
Altered epigenetic regulation of homeobox genes in human oral squamous cell carcinoma cells
Abstract
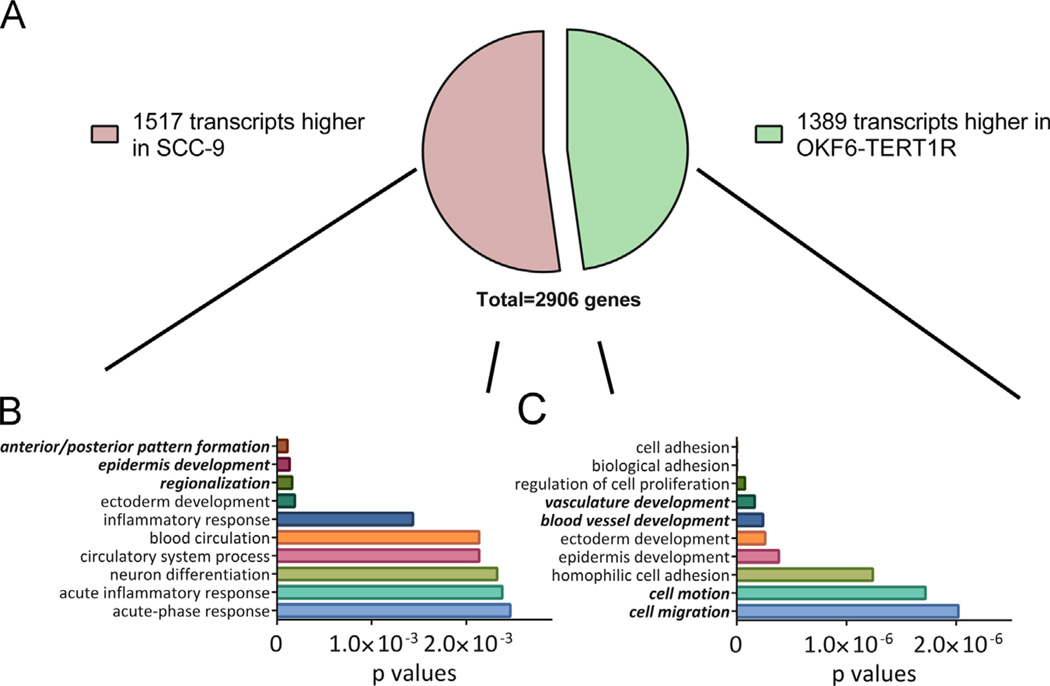
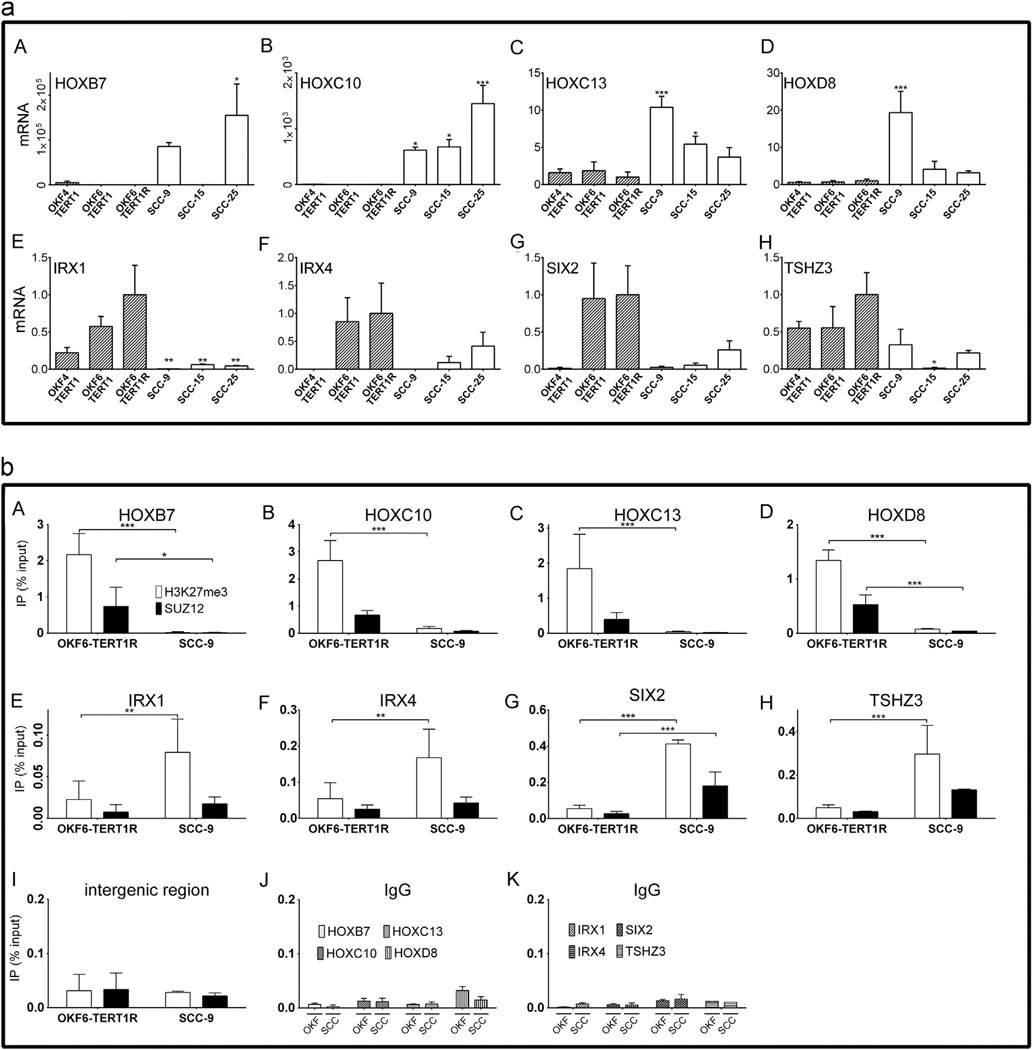
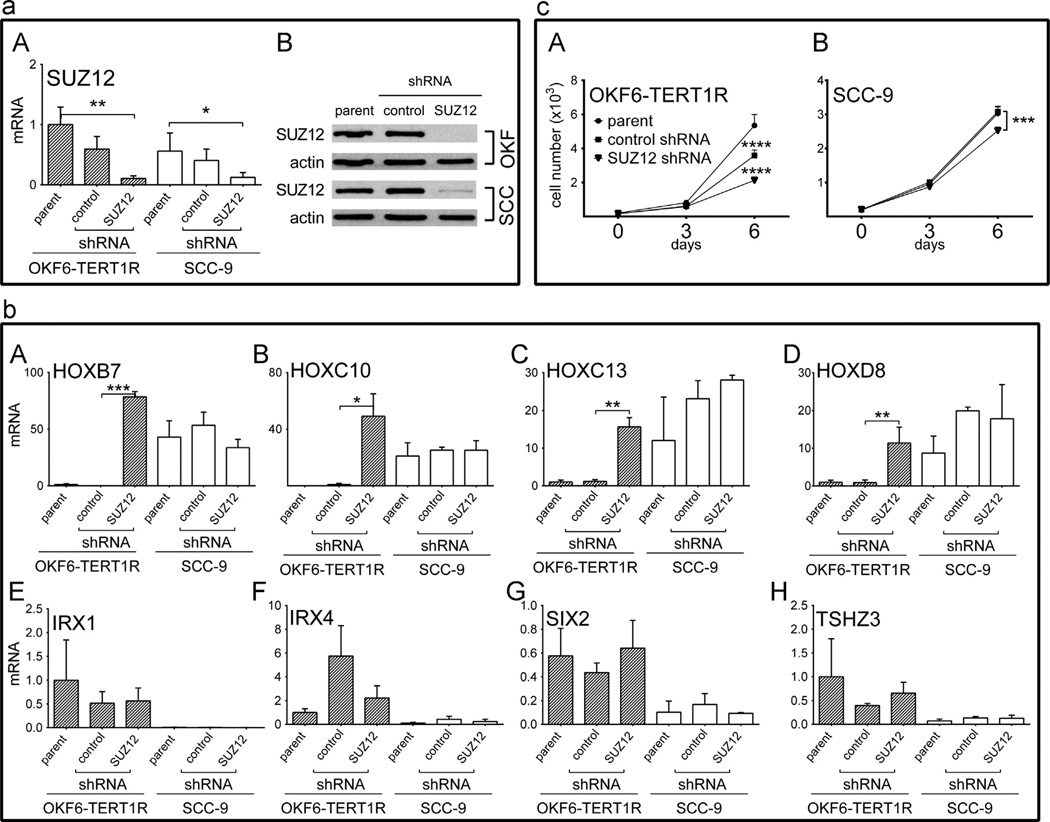
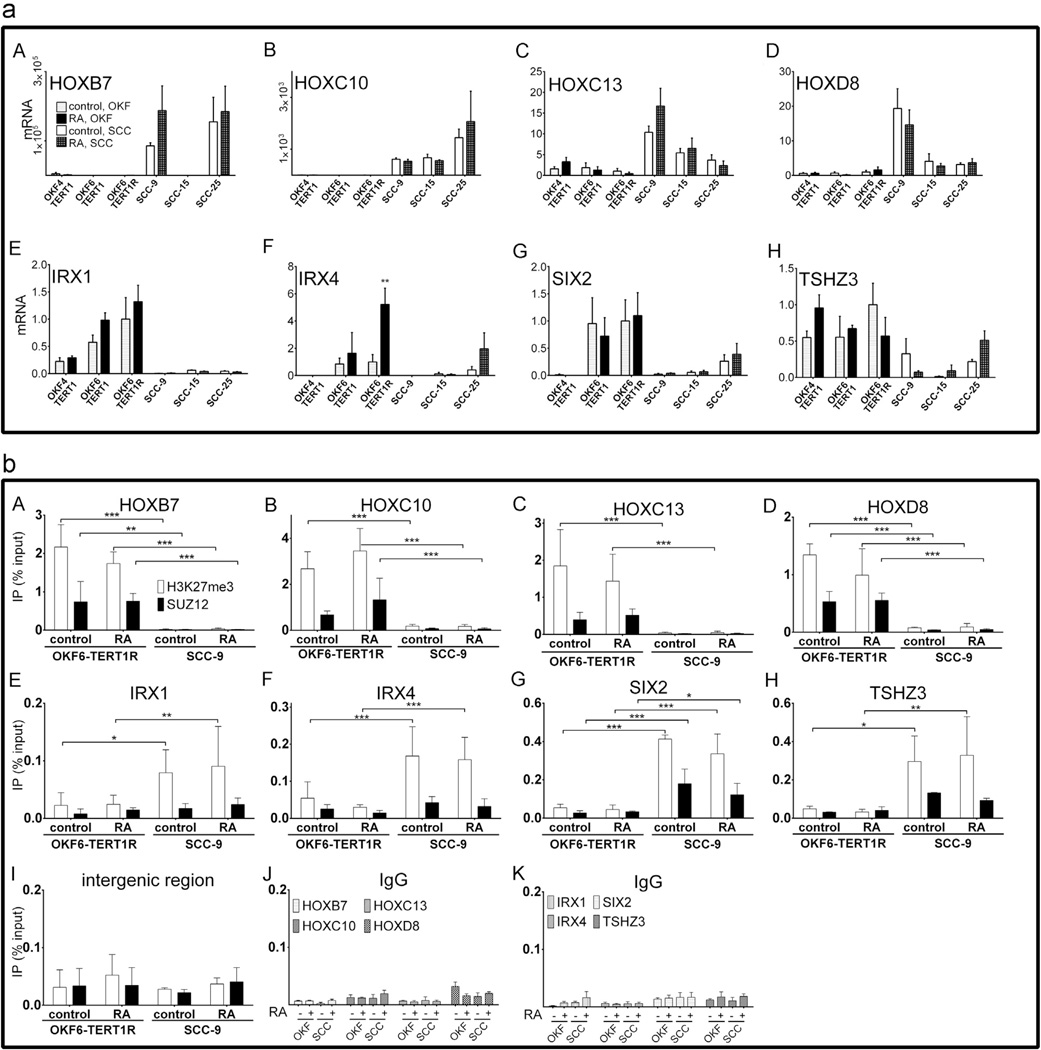
To gain insight into oral squamous cell carcinogenesis, we performed deep sequencing (RNAseq) of non-tumorigenic human OKF6-TERT1R and tumorigenic SCC-9 cells. Numerous homeobox genes are differentially expressed between OKF6-TERT1R and SCC-9 cells. Data from Oncomine, a cancer microarray database, also show that homeobox (HOX) genes are dysregulated in oral SCC patients. The activity of Polycomb repressive complexes (PRC), which causes epigenetic modifications, and retinoic acid (RA) signaling can control HOX gene transcription. HOXB7, HOXC10, HOXC13, and HOXD8 transcripts are higher in SCC-9 than in OKF6-TERT1R cells; using ChIP (chromatin immunoprecipitation) we detected PRC2 protein SUZ12 and the epigenetic H3K27me3 mark on histone H3 at these genes in OKF6-TERT1R, but not in SCC-9 cells. In contrast, IRX1, IRX4, SIX2 and TSHZ3 transcripts are lower in SCC-9 than in OKF6-TERT1R cells. We detected SUZ12 and the H3K27me3 mark at these genes in SCC-9, but not in OKF6-TERT1R cells. SUZ12 depletion increased HOXB7, HOXC10, HOXC13, and HOXD8 transcript levels and decreased the proliferation of OKF6-TERT1R cells. Transcriptional responses to RA are attenuated in SCC-9 versus OKF6-TERT1R cells. SUZ12 and H3K27me3 levels were not altered by RA at these HOX genes in SCC-9 and OKF6-TERT1R cells. We conclude that altered activity of PRC2 is associated with dysregulation of homeobox gene expression in human SCC cells, and that this dysregulation potentially plays a role in the neoplastic transformation of oral keratinocytes.
Keywords: ChIP; Chromatin; Epigenetic silencing; GAPDH; GO; H3K27me3; HNSCC; HOX; HPRT1; Head and neck squamous cell carcinoma; Homeobox; OSCC; Oral squamous cell carcinoma; PRC; Polycomb; RA; RAR; RARE; RNA sequencing; RNA-seq; RNAseq; RXR; Retinoic acid; SCC; SUZ12; TNM; TNM classification of malignant tumours; Tumorigenesis; WCMC; Weill Cornell Medical College; chromatin immunoprecipitation; gene ontology; glyceraldehyde 3-phosphate dehydrogenase; head and neck squamous cell carcinoma; histone 3 lysine 27 trimethyl; homeobox; hypoxanthine phosphoribosyltransferase 1; oral squamous cell carcinoma; polycomb repressive complexes; qRT-PCR; quantitative real time polymerase chain reaction; retinoic acid; retinoic acid receptor; retinoic acid response element; retinoid X receptor; shRNA; short hairpin RNA; squamous cell carcinoma.
© 2013 Elsevier Inc. All rights reserved.
Conflict of interest statement
The authors disclose no potential conflicts of interest.
Figures
Similar articles
-
Altered histone mark deposition and DNA methylation at homeobox genes in human oral squamous cell carcinoma.J Cell Physiol. 2014 Oct;229(10):1405-16. doi: 10.1002/jcp.24577. J Cell Physiol. 2014. PMID: 24519855 Free PMC article.
-
Dynamics of HOX gene expression and regulation in adipocyte development.Gene. 2021 Feb 5;768:145308. doi: 10.1016/j.gene.2020.145308. Epub 2020 Nov 13. Gene. 2021. PMID: 33197517
-
Abnormal expression of retinoic acid receptors and keratin 19 by human oral and epidermal squamous cell carcinoma cell lines.Cancer Res. 1991 Aug 1;51(15):3972-81. Cancer Res. 1991. PMID: 1713123
-
Histone modifications in oral squamous cell carcinoma and oral potentially malignant disorders.Oral Dis. 2020 May;26(4):719-732. doi: 10.1111/odi.13115. Epub 2019 Jul 26. Oral Dis. 2020. PMID: 31056829 Review.
-
Polycomb Repressive Complexes in Hox Gene Regulation: Silencing and Beyond: The Functional Dynamics of Polycomb Repressive Complexes in Hox Gene Regulation.Bioessays. 2020 Oct;42(10):e1900249. doi: 10.1002/bies.201900249. Epub 2020 Aug 2. Bioessays. 2020. PMID: 32743818 Review.
Cited by
-
Integrated computational analysis reveals HOX genes cluster as oncogenic drivers in head and neck squamous cell carcinoma.Sci Rep. 2022 May 13;12(1):7952. doi: 10.1038/s41598-022-11590-1. Sci Rep. 2022. PMID: 35562533 Free PMC article.
-
MicroRNA-196a-5p is a potential prognostic marker of delayed lymph node metastasis in early-stage tongue squamous cell carcinoma.Oncol Lett. 2018 Feb;15(2):2349-2363. doi: 10.3892/ol.2017.7562. Epub 2017 Dec 8. Oncol Lett. 2018. PMID: 29434944 Free PMC article.
-
The Widening Sphere of Influence of HOXB7 in Solid Tumors.Cancer Res. 2016 May 15;76(10):2857-62. doi: 10.1158/0008-5472.CAN-15-3444. Epub 2016 Apr 20. Cancer Res. 2016. PMID: 27197229 Free PMC article. Review.
-
Reactivation of super-enhancers by KLF4 in human Head and Neck Squamous Cell Carcinoma.Oncogene. 2020 Jan;39(2):262-277. doi: 10.1038/s41388-019-0990-4. Epub 2019 Sep 2. Oncogene. 2020. PMID: 31477832
-
Epigenetic Regulation in Oral Squamous Cell Carcinoma Microenvironment: A Comprehensive Review.Cancers (Basel). 2023 Nov 27;15(23):5600. doi: 10.3390/cancers15235600. Cancers (Basel). 2023. PMID: 38067304 Free PMC article. Review.
References
-
- Curado MP, Hashibe M. Recent changes in the epidemiology of head and neck cancer. Curr. Opin. Oncol. 2009;21:194–200. - PubMed
-
- Siegel R, Naishadham D, Jemal A. Cancer statistics, 2013. CA: Cancer J. Clin. 2013;63:11–30. - PubMed
-
- Means AL, Gudas LJ. The roles of retinoids in vertebrate development. Annu. Rev. Biochem. 1995;64:201–233. - PubMed
-
- Chambon P. A decade of molecular biology of retinoic acid receptors. FASEB J. 1996;10:940–954. - PubMed
-
- Langston AW, Gudas LJ. Identification of a retinoic acid responsive enhancer 3′ of the murine homeobox gene Hox-1.6. Mech. Dev. 1992;38:217–227. - PubMed
Publication types
MeSH terms
Substances
Grants and funding
LinkOut - more resources
Full Text Sources
Other Literature Sources
Medical
Molecular Biology Databases
Research Materials
Miscellaneous
