. 2013 Dec;87(24):13193-205.
doi: 10.1128/JVI.02420-13. Epub 2013 Sep 25.

Polycomb repressive complex 2 silences human cytomegalovirus transcription in quiescent infection models

Affiliations

Polycomb repressive complex 2 silences human cytomegalovirus transcription in quiescent infection models

Christopher G Abraham et al. J Virol. 2013 Dec.

Abstract

Chromatin-based regulation of herpesviral transcriptional programs is increasingly appreciated as a mechanism for modulating infection outcomes. Transcriptionally permissive euchromatin predominates during lytic infection, whereas heterochromatin domains refractory to transcription are enriched at lytic genes during latency. Reversibly silenced facultative heterochromatin domains are often enriched for histone H3 trimethylated on lysine 27 (H3K27me3), a modification catalyzed by Polycomb repressive complex 2 (PRC2). The requirement for PRC2 in suppressing the human cytomegalovirus (HCMV) lytic transcriptional program during latency has not been thoroughly evaluated. Therefore, we disrupted PRC2 activity in the highly tractable THP1 and NT2D1 quiescent-infection models by treating cells with small-molecule inhibitors of PRC2 activity. Compared to control cells, disruption of PRC2 in HCMV-infected THP1 or NT2D1 cells resulted in significant increases in viral transcript levels and the detection of viral protein. Using chromatin immunoprecipitation, we demonstrated that enrichment of H3K27me3, deposited by PRC2, correlates inversely with lytic transcriptional output, suggesting that PRC2 catalytic activity at viral chromatin directly represses lytic transcription. Together, our data suggest that PRC2-mediated repression of viral transcription is a key step in the establishment and maintenance of HCMV latency.


Figures
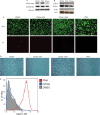
Fig 1
Fig 1
DZnep treatment inhibits PRC2 catalytic activity and decreases EZH2 protein levels in THP1 monocytes. Whole-cell lysates were prepared from THP1 monocytes treated with 5 μM DZnep, 0.2 μM PMA, or DMSO for 3 days. (A) Western blot analysis of H3K27me3 and H3K36me3. Total H3 served as a loading control. (B) Western blot analysis of PRC2 components EZH2 and SUZ12 and of the chromatin binding protein HP1. Actin served as a loading control. (C) Fluorescence microscopy of THP1 cells, treated as indicated, following FDA or PI staining for viability. (D) Bright-field microscopy of morphological changes of THP1 cells, treated as indicated. (E) CD11b/MAC-1 expression on the surfaces of THP1 cells, treated as indicated.
Fig 2
Fig 2
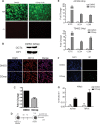
DZnep treatment primes nonpermissive THP1 cells for HCMV AD169 lytic mRNA expression. (A) Schematic diagram of the treatment and infection protocol. Cells were infected with AD169 at an MOI of 0.02. d, day. (B) Quantification of viral copy numbers in infected treated cells. Total DNA was prepared at 2 hpi, and relative viral copy numbers were quantified by qPCR. The relative genome copy number is reported as the mean fold change from the copy number in DMSO-treated cells for three biological replicates. Error bars, standard errors of the means. (C) Gene expression analysis in HCMV AD169-infected THP1 cells pretreated with DMSO, DZnep, or PMA. The expression levels of the major immediate early genes IE1/2, the early gene UL54, and the late gene UL99 were measured by qRT-PCR at the indicated times postinfection and are represented as the mean fold changes from the expression levels in DMSO-treated cells. Data are averages for three biological replicates, and error bars reflect the standard errors of the means of the normalized expression levels. Asterisks indicate P values of <0.05 (*), <0.01 (**), <0.001 (***), or <0.0001 (****) by two-way ANOVA followed by Dunnett's multiple-comparison posttest. (D) THP1 cells were infected with TB40E at an MOI of 0.2 as outlined in panel A. At 24 hpi, the expression of IE, E, and L loci, as indicated, in HCMV TB40E-infected THP1 cells pretreated with DMSO or DZnep was analyzed. Data are averages for three biological replicates, and error bars reflect the standard errors of the means of the normalized expression levels. Asterisks indicate P values of <0.05 (*), <0.01 (**), or <0.001 (***) by paired, two-tailed t tests. (E) Western blot analysis of AD169 IE1 protein accumulation in DZnep-treated THP1 cells. THP1 cells were treated as described in the legend to Fig. 1 and were infected with AD169 at an MOI of 1.0. Whole-cell lysates were prepared at 24 hpi, and IE1 protein expression was detected by Western blotting. HP1 served as a loading control.
Fig 3
Fig 3
DZnep treatment primes pluripotent NT2D1 cells for HCMV AD169 lytic gene expression. (A) Fluorescence microscopy of NT2D1 cells, treated as indicated, following FDA or PI staining for viability. (B) Differentiation analysis. (C) Quantification of viral copy numbers in infected treated cells. Total DNA was prepared at 2 hpi, and the relative viral copy number was quantified by qPCR. The relative genome copy number is reported as the mean fold change in the copy number from that in DMSO-treated cells for three biological replicates. Error bars, standard errors of the means. (D) Schematic diagram of the treatment and infection protocol. Cells were infected at an MOI of 1.0. (E) At 24 hpi, gene expression in cells pretreated with DMSO or DZnep and infected with AD169 or TB40 was analyzed as described in the legend to Fig. 2. Asterisks indicate P values of <0.05 (*) or <0.01 (**) by paired, two-tailed t tests. (F) IE1 protein accumulation in DZnep-treated NT2D1 cells. The expression of IE1 protein in NT2D1 cells infected with AD169 or TB40E at an MOI of 1.0 was analyzed by immunofluorescence at 48 hpi. (G) Quantification of IE1-positive cells from the immunofluorescence assay for which results are shown in panel F. Bars represent the mean percentages of cells staining positive for IE1 protein within a 10× field of magnification. Results are from four random fields of view. Error bars, standard errors of the means.
Fig 4
Fig 4
(A and B) DZnep treatment activates the AD169 lytic transcription program in quiescently infected THP1 monocytes. (A) Schematic diagram of the treatment and infection protocol. Cells were infected with AD169 at an MOI of 1.0. (B) HCMV lytic mRNA expression. qPCR was performed, and data were analyzed and graphed, as described in the legend to Fig. 2. Asterisks indicate P values of <0.05 (*) or <0.01 (**) by paired, two-tailed t tests. (C and D) DZnep treatment reactivates the HCMV lytic transcription program in pluripotent NT2D1 cells. (C) Schematic diagram of the treatment and infection protocol. Cells were infected with AD169 or TB40E at an MOI of 1.0. (D) AD169 or TB40E lytic gene mRNA expression. qPCR was performed, and data were analyzed and graphed, as described for Fig. 2. Asterisks indicate P values of <0.05 (*), <0.01 (**), or <0.001 (***) by paired, two-tailed t tests.
Fig 5
Fig 5
PRC2 activity correlates inversely with AD169 lytic transcriptional levels in THP1 monocytes. (A) Schematic diagram of the MIE and UL69 loci of AD169. Open boxes represent regions probed for H3K27me3 enrichment: Enh., the enhancer region; TSS, the transcriptional start site of the IE1/2 transcriptional unit; Exon, exon 2 within the open reading frame of the IE1/2 locus. Bent arrows indicate +1 transcriptional start sites. The distal enhancer region is indicated. Shaded arrows represent exons. (B) THP1 monocytes were treated as described in the legend to Fig. 1 and were infected with AD169 at an MOI of 1. At 48 hpi, ChIP was performed using anti-H3K27me3, anti-pan-H3, and normal rabbit IgG. The material recovered was analyzed by qPCR using primer-probe sets specific for the indicated loci. Each bar represents the IgG-normalized H3K27me3/H3 ratio for each viral locus relative to that for the negative-control region, PLCB4.
Fig 6
Fig 6
PRC2 rapidly targets HCMV chromatin for H3K27me3 during infection of pluripotent NT2D1 cells. NT2D1 cells were infected with AD169 (A) or TB40E (B) at an MOI of 1.0. At 48 hpi, ChIP was performed using anti-H3K27me3, anti-pan-H3, and normal rabbit IgG. The material recovered was analyzed by qPCR using primer-probe sets specific for the indicated loci (abbreviations explained in the legend to Fig. 5A). Each bar represents the IgG-normalized H3K27me3/H3 ratio for the viral locus queried, the negative-control region, PLCB4, or the positive-control region, HOXA9. Ratios are means of data collected from at least three biological replicates; error bars represent standard errors of the means. Asterisks indicate P values of <0.05 (*), <0.01 (**), <0.001 (***), or <0.0001 (****) by paired, two-tailed t tests.
Fig 7
Fig 7
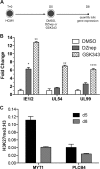
Treatment with the EZH2-specific inhibitor GSK343 reactivates the AD169 lytic transcription program in THP1 monocytes. (A) Schematic diagram of the treatment and infection protocol. Cells were infected with AD169 or TB40E at an MOI of 1.0; infected cells were treated daily with either DMSO, 5 μM DZnep, or 10 μM GSK343. (B) HCMV lytic mRNA expression. qPCR was performed, and data were analyzed and presented, as described above. Significance was calculated using paired, two-tailed t tests. Asterisks indicate P values of <0.05 (*), <0.01 (**), or <0.0001 (****). (C) ChIPs were performed using anti-H3K27me3, anti-pan-H3, and normal rabbit IgG. The material recovered was analyzed by qPCR using primer-probe sets specific for the indicated cellular loci, before and after GSK343 treatment. Each bar represents the IgG-normalized H3K27me3/H3 ratio for the locus indicated.

Similar articles

Cited by

References

    1. Mocarski ES, Shenk T, Pass RF. 2007. Cytomegaloviruses, p 2701–2772 In Knipe DM, Howley PM, Griffin DE, Lamb RA, Martin MA, Roizman B, Straus SE. (ed), Fields virology, 5th ed, vol 2 Lippincott Williams & Wilkins, Philadelphia, PA
    1. Hahn G, Jores R, Mocarski ES. 1998. Cytomegalovirus remains latent in a common precursor of dendritic and myeloid cells. Proc. Natl. Acad. Sci. U. S. A. 95:3937–3942 - PMC - PubMed
    1. Goodrum FD, Jordan CT, High K, Shenk T. 2002. Human cytomegalovirus gene expression during infection of primary hematopoietic progenitor cells: a model for latency. Proc. Natl. Acad. Sci. U. S. A. 99:16255–16260 - PMC - PubMed
    1. Sinclair J. 2008. Human cytomegalovirus: latency and reactivation in the myeloid lineage. J. Clin. Virol. 41:180–185 - PubMed
    1. Nitzsche A, Paulus C, Nevels M. 2008. Temporal dynamics of cytomegalovirus chromatin assembly in productively infected human cells. J. Virol. 82:11167–11180 - PMC - PubMed

Publication types

MeSH terms

Substances