Comparative Study
. 2013 Dec;87(23):12838-49.
doi: 10.1128/JVI.02374-13. Epub 2013 Sep 25.

Comprehensive mapping and analysis of Kaposi's sarcoma-associated herpesvirus 3' UTRs identify differential posttranscriptional control of gene expression in lytic versus latent infection

Affiliations
Comparative Study

Comprehensive mapping and analysis of Kaposi's sarcoma-associated herpesvirus 3' UTRs identify differential posttranscriptional control of gene expression in lytic versus latent infection

Lydia V McClure et al. J Virol. 2013 Dec.

Abstract

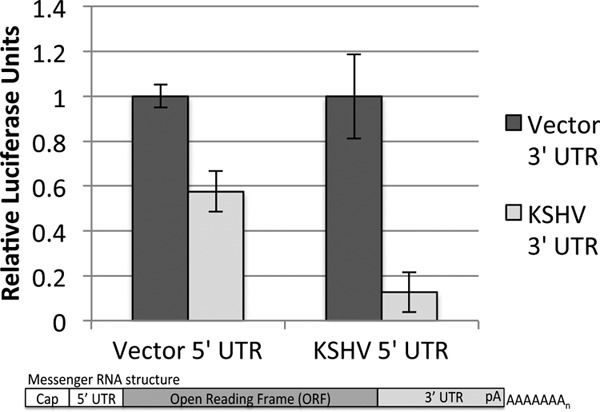
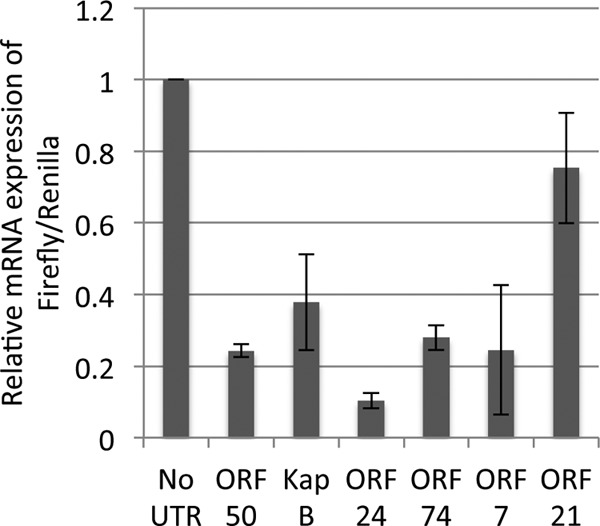
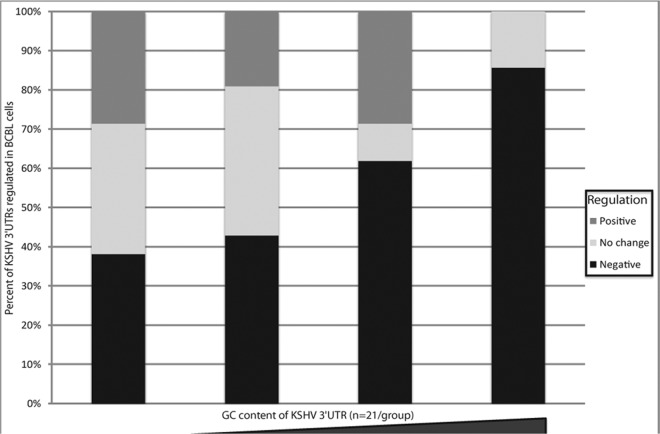
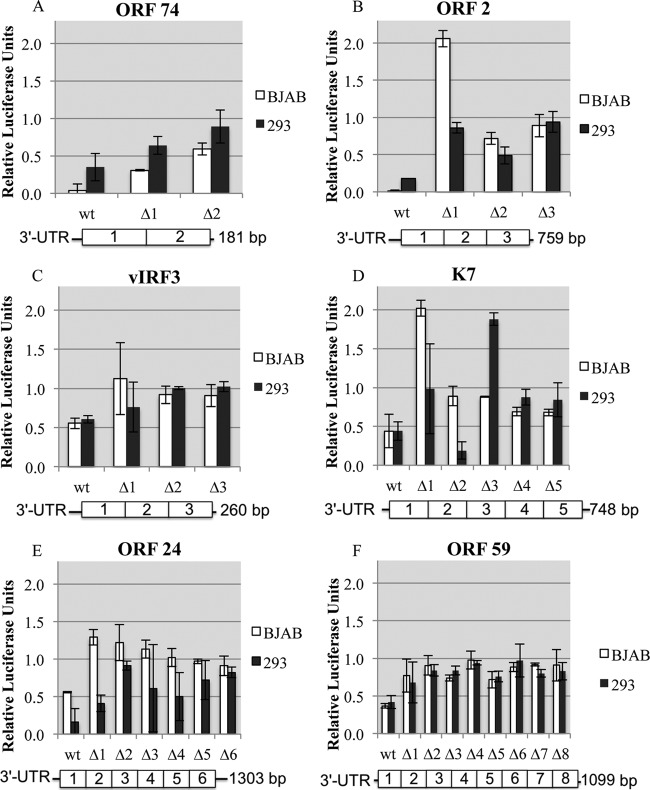
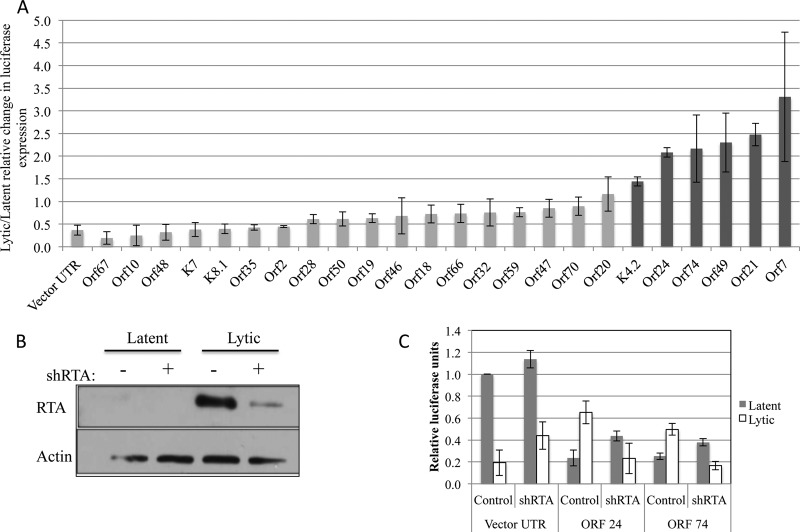
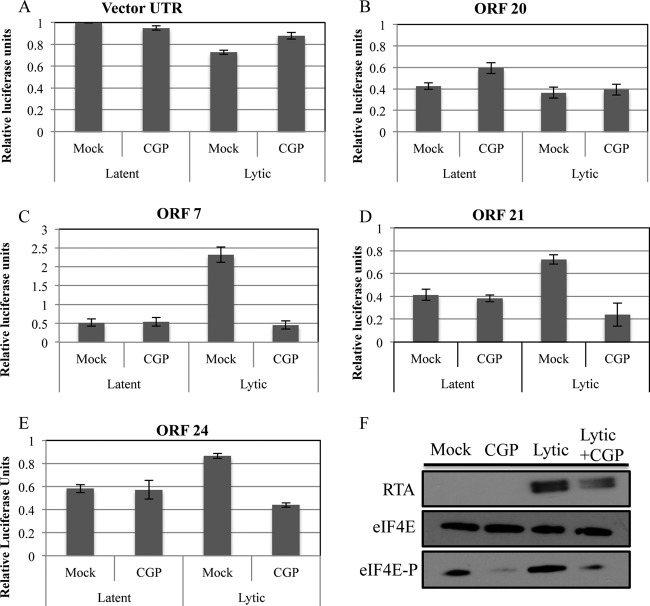
3' untranslated regions (UTRs) are known to play an important role in posttranscriptional regulation of gene expression. Here we map the 3' UTRs of Kaposi's sarcoma-associated herpesvirus (KSHV) using next-generation RNA sequencing, 3' rapid amplification of cDNA ends (RACE), and tiled microarray analyses. Chimeric reporters containing the KSHV 3' UTRs show a general trend toward reduced gene expression under conditions of latent infection. Those 3' UTRs with a higher GC content are more likely to be associated with reduced gene expression. KSHV transcripts display an extensive use of shared polyadenylation sites allowing for partially overlapping 3' UTRs and regulatory activities. In addition, a subset of KSHV 3' UTRs is sufficient to convey increased gene expression under conditions of lytic infection. These results suggest a role for viral 3' UTRs in contributing to differential gene expression during latent versus lytic infection.


Figures

Fig 1
Fig 1
Map of the KSHV 3′ UTRs. KSHV transcript termination sites are shown in either the sense (upward peak) or antisense (downward peak) orientation annotated by next-generation RNAseq analysis. A linearized KSHV genomic map is presented, with each KSHV 3′ UTR (gray arrows) confirmed by 3′ RACE, KSHV DNA tiling microarray analysis, and/or bioinformatic prediction shown. Each of the 84 ORFs is displayed by its position and general timing of expression (green, latent; yellow, immediate early; orange, early; blue, late). Poly(A)-enriched RNA was prepared from latent or lytically induced (24 and 48 h) TREx-RTA BCBL-1 cells. Sequencing results are filtered for the last nucleotide after a string of 10 adenine nucleotides, indicating a transcription stop site. The y axis shows read density coverage plotted on a log scale; the x axis shows nucleotide position in the KSHV genome.
Fig 2
Fig 2
Regulatory activity of KSHV 3′ UTRs on chimeric reporters. TREx-RTA BCBL-1 cells were transfected with chimeric 3′ UTR luciferase reporters, and luciferase assays were conducted. Half of the 3′ UTRs conveyed >30% negative regulation in cells latently infected with KSHV (TREx-RTA BCBL-1). In contrast, <15% of the 3′ UTRs conveyed >30% positive regulation of gene expression. Black bars represent negatively regulated reporters, gray bars represent neutral (unregulated) reporters, and white bars indicate positively regulated reporters. Data presented are the averages ± standard deviations of luciferase units from three biological replicates normalized to a cotransfected Renilla control and also normalized to a parental vector 3′ UTR.
Fig 3
Fig 3
KSHV 3′ UTR chimeric reporters share regulatory potential in different cell lines. Each luciferase reporter was screened in latently infected B lymphocytes (BCBL), uninfected B lymphocytes (BJAB), or non-B cells (HEK 293) and is represented once on this Venn diagram (see Table S6 and Fig. S2 in the supplemental material). Seventy-eight of the 84 KSHV 3′ UTRs showed similar regulation in two or more cell lines. Only 6 of the KSHV 3′ UTRs conveyed negative regulation in only a single cell type.
Fig 4
Fig 4
Preservation of the regulatory activity of the K7 3′ UTR in the context of its natural 5′ UTR. 5′ RACE was used to experimentally identify the native K7 5′ UTR expressed in TREx-RTA BCBL-1 cells. Luciferase assays were conducted on chimeric reporter constructs that contained either vector-derived or K7 5′ and 3′ UTRs. Data presented are the averages ± standard deviations of luciferase units from three biological replicates normalized to a cotransfected Renilla control and also normalized to a pair-matched vector 3′ UTR.
Fig 5
Fig 5
Decreased steady-state levels of transcripts bearing KSHV 3′ UTRs. A subset of chimeric luciferase reporter constructs shown to convey negative regulation (Fig. 2) were transfected into TREx-RTA BCBL-1 cells, and total RNA was prepared. Data from qRT-PCR analysis of the firefly luciferase chimeric reporter were normalized to data for transcripts from the Renilla luciferase control reporter. Data represent the averages ± standard errors of three independent experiments.
Fig 6
Fig 6
Higher-GC-content KSHV 3′ UTRs are more likely to convey negative regulation. The KSHV 3′ UTRs were divided into four groups comprised of an equal number of members based on their GC content (n = 21 3′). The leftmost bar plots the transcripts with the lowest GC content, and the rightmost bar plots the transcripts with the highest GC content. The percentages of transcripts from each group are plotted.
Fig 7
Fig 7
Most mutants of KSHV 3′ UTRs have less regulatory potential. Luciferase assays were conducted on mutants of select KSHV 3′ UTR reporters in BJAB and HEK 293 cells. The length of each 3′ UTR (base pairs) is shown next to the graphical representation for the UTR mutants. The 3′ UTRs assayed were ORF 74 (A), ORF 2 (B), v-IRF3 (C), K7 (D), ORF 24 (E), and ORF 59 (F). Each 3′ UTR mutant was designed to have a 60- to 100-bp truncation or internal deletion. The majority of the 3′ UTR mutants conveyed less regulation, indicating overall structure as a possible determinant in regulating gene expression. Cells were harvested for luciferase expression analysis 36 h after transfection. Data represent the averages ± standard deviations from three biological replicates normalized to data from a cotransfected Renilla transcript and a firefly luciferase parental vector-derived 3′ UTR control.
Fig 8
Fig 8
A subset of KSHV 3′ UTRs convey negative regulation during latent infection but positive regulation during lytic replication. Select KSHV 3′ UTR reporters were transfected into TREx-RTA BCBL-1 cells, and a portion of the cells was induced into lytic replication 24 h after transfection. (A) Luciferase assays were conducted 36 h after lytic induction. Most transcripts were subjected to a reduced or unchanged ratio of expression after lytic induction (light gray bars); however, six KSHV 3′ UTRs displayed a higher ratio of expression during lytic infection than in latently infected cells (dark gray bars). Each bar represents data from three biological experiments under conditions of both lytic and latent infection. For each individual experiment, the averages from three technical replicates of luciferase expression from lytic induction were compared to the averages from three technical replicates of luciferase expression from latent infection. (B and C) RTA is required during lytic replication to convey positive regulation of some KSHV 3′ UTRs. TREx-RTA BCBL-1 cells were electroporated with the luciferase constructs and an shRNA against KSHV RTA (shRTA) and allowed to recover for 24 h. Cells were then lytically induced, harvested after 36 h, and analyzed by Western blot analysis (B) or luciferase analysis (C). Cells treated with the shRNA against RTA showed a loss of positive gene expression conveyed by the ORF 24 and ORF 74 3′ UTRs after lytic induction (C). Data represent the averages ± standard deviations from three biological replicates normalized to data from a cotransfected Renilla luciferase transcript and to data from a firefly transcript containing a minimal vector 3′ UTR.
Fig 9
Fig 9
MNK1 kinase activity is required for an increase in gene expression levels mediated by KSHV 3′ UTRs during lytic infection. TREx-RTA BCBL-1 cells were transfected with a subset of KSHV 3′ UTR reporters and allowed to recover for 24 h before lytic induction and treatment with an MNK1 inhibitor (CGP57380 [CGP]). Cells were harvested after 36 h (60 h after electroporation) and analyzed by a luciferase assay (A to E) or Western immunoblot analysis (F). 3′ UTR reporters that displayed increased gene expression during lytic infection (C to E) no longer showed this regulation in the presence of the MNK1 inhibitor. Data for luciferase assays represent the averages ± standard deviations from three biological replicates normalized to data for a cotransfected Renilla control transcript and to data for a firefly luciferase parental vector-derived 3′ UTR. Panel F shows an immunoblot analysis demonstrating the effects of the MNK1 inhibitor on the phosphorylation status of eIF4E and RTA protein levels. eIF4E-P refers to the phosphorylated form of eIF4E.

Similar articles

Cited by

References

    1. Elkon R, Ugalde AP, Agami R. 2013. Alternative cleavage and polyadenylation: extent, regulation and function. Nat. Rev. Genet. 14:496–506 - PubMed
    1. Calin GA, Liu CG, Sevignani C, Ferracin M, Felli N, Dumitru CD, Shimizu M, Cimmino A, Zupo S, Dono M, Dell'Aquila ML, Alder H, Rassenti L, Kipps TJ, Bullrich F, Negrini M, Croce CM. 2004. MicroRNA profiling reveals distinct signatures in B cell chronic lymphocytic leukemias. Proc. Natl. Acad. Sci. U. S. A. 101:11755–11760 - PMC - PubMed
    1. Lin YT, Sullivan CS. 2011. Expanding the role of Drosha to the regulation of viral gene expression. Proc. Natl. Acad. Sci. U. S. A. 108:11229–11234 - PMC - PubMed
    1. Shaw G, Kamen R. 1986. A conserved AU sequence from the 3′ untranslated region of GM-CSF mRNA mediates selective mRNA degradation. Cell 46:659–667 - PubMed
    1. Zhang Y, Xie RL, Croce CM, Stein JL, Lian JB, van Wijnen AJ, Stein GS. 2011. A program of microRNAs controls osteogenic lineage progression by targeting transcription factor Runx2. Proc. Natl. Acad. Sci. U. S. A. 108:9863–9868 - PMC - PubMed

Publication types

LinkOut - more resources