. 2014 Aug 14;33(33):4203-12.
doi: 10.1038/onc.2013.377. Epub 2013 Sep 23.

Macrophage contact induces RhoA GTPase signaling to trigger tumor cell intravasation

Affiliations

Macrophage contact induces RhoA GTPase signaling to trigger tumor cell intravasation

M Roh-Johnson et al. Oncogene. .

Abstract

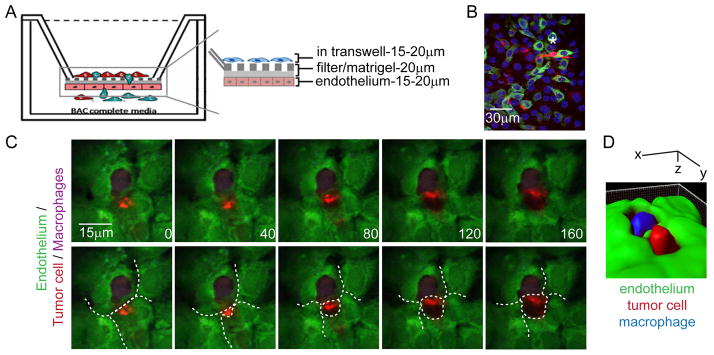
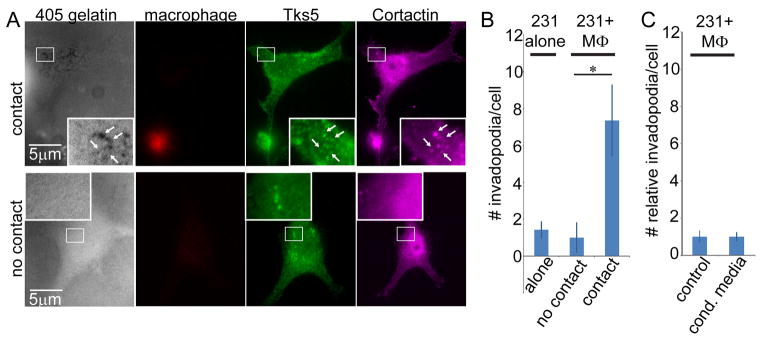
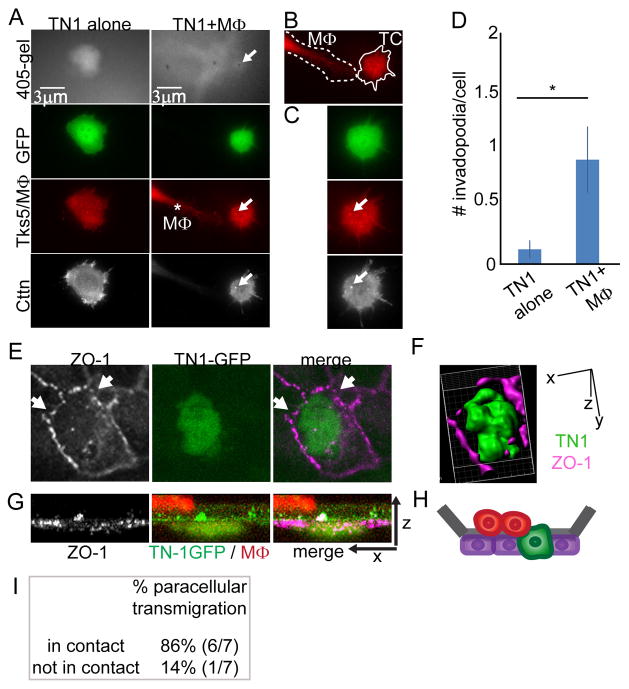
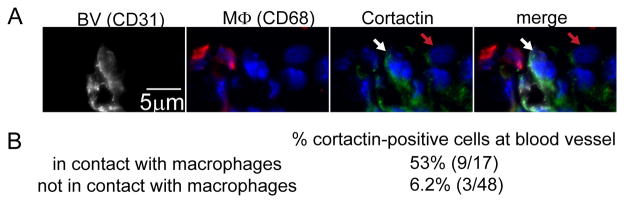
Most cancer patients die as a result of metastasis, thus it is important to understand the molecular mechanisms of dissemination, including intra- and extravasation. Although the mechanisms of extravasation have been vastly studied in vitro and in vivo, the process of intravasation is still unclear. Furthermore, how cells in the tumor microenvironment facilitate tumor cell intravasation is still unknown. Using high-resolution imaging, we found that macrophages enhance tumor cell intravasation upon physical contact. Macrophage and tumor cell contact induce RhoA activity in tumor cells, triggering the formation of actin-rich degradative protrusions called invadopodia, enabling tumor cells to degrade and break through matrix barriers during tumor cell transendothelial migration. Interestingly, we show that macrophage-induced invadopodium formation and tumor cell intravasation also occur in patient-derived tumor cells and in vivo models, revealing a conserved mechanism of tumor cell intravasation. Our results illustrate a novel heterotypic cell contact-mediated signaling role for RhoA, as well as yield mechanistic insight into the ability of cells within the tumor microenvironment to facilitate steps of the metastatic cascade.


Conflict of interest statement

The authors have no conflicts of interests to declare.

Figures

Figure 1
Figure 1
Tumor cells physically interact with macrophages during transendothelial migration. (A) Diagram of transwell experiment. (B) Fixed image of apical section of transwell with tumor cell (MDA-MB-231-GFP, green) and macrophage (CMPTX-labeled, red) physically interacting in the endothelium (blue, DAPI). Asterisk marks tumor cells in contact with macrophages at endothelium. (C) Still images from en face view of movie of tumor cell (red) transmigrating through endothelium (green) next to a macrophage (purple). Images are every 40 minutes. Dark region of tumor cell is nucleus since dtomato space fill was used. White dashed lines mark edges of endothelial cells (bottom panel). Transendothelial migration of tumor cell is depicted by the broadening of outlined area within the endothelium. (D) IMARIS 3D reconstruction of cells shown in “C” revealing tumor cell (red) penetrating through endothelium (green) in the Z-axis next to a macrophage (blue).
Figure 2
Figure 2
Macrophages facilitate 231 transendothelial migration. (A) Merge of apical 12 microns of HUVEC transwells. MDA-MB-231 cells alone (green) and endothelium marked by phalloidin-rhodamine (red). (B) Merge of apical 12 microns of HUVEC transwells with MDA-MB-231 cells (green) and macrophages (unlabeled) added. Endothelium marked by phalloidin-rhodamine (red). (C) Quantification of number of MDA-MB-231 cells exposed to the apical surface of HUVEC transwells per field of view (512×512 μm), as a relative number to 231 GFP control. Mean ± SEM, T-test p<0.05. n=25 for each, 6 independent experiments. (D) Tight juntions (ZO-1, white) immunostaining of transwells when tumor cell (231 tomato, red) is undergoing transendothelial migration when in contact with a macrophage (green). White arrows mark absence of ZO-1 immunostaining. (E) Quantification of tumor cells undergoing transmigration on transwells when in contact or not in contact with macrophages. n=22, 5 independent experiments.
Figure 3
Figure 3
Macrophages induce invadopodium formation in MDA-MB-231 cells. (A, B) Immunostaining of MDA-MB-231 cells for tks5 and cortactin in the presence and absence of macrophages on 405-labelled gelatin matrix. Top panels shows MDA-MB-231 cell in contact with macrophage (red). Inset is zoomed region of white box in panels. Arrows mark invadopodia, defined as cortactin and tks5 positive invadopodia that degrade matrix. Bottom panels show MDA-MB-231 cell that is not in contact with a macrophage. (B) Quantification of number of invadopodia per cell when MDA-MB-231 cells plated with macrophages or when MDA-MB-231 cells plated alone. Mean ± SEM, ANOVA p = 0.0003. n=60 (alone), 18 (no contact), 41 (contact) cells; 6 independent experiments. (C) Quantification of number of invadopodia per cell when MDA-MB-231 cells plated in BAC1.2F5 conditioned media. Mean ± SEM as a ratio of control. n=34 (ctrl), 30 (conditioned) cells; 2 independent experiments.
Figure 4
Figure 4
Invadopodia are required for transendothelial migration. (A) Invadopodia form as MDA-MB-231 cells undergo transendothelial migration. Immunostaining for ZO-1 (white in left panel, purple in merge) of transwells with MDA-MB-231 cells transfected with Cortactin-tagRFP (red). White arrowheads mark lacdisassembled tight junctions. Red arrow marks cortactin enrichment in tumor cell as the cell penetrates through the endothelium. (B) tks5 smartpool siRNA knockdown western blot with actin as loading control. Quantification of tks5 fluorescence below. (C) qRT-PCR of control and Tks5 siRNA cells to show tks5 mRNA reduction in Tks5 siRNA cells. n=3 replicates. (D) Representative images of control and tks5 siRNA MDA-MB-231 cells immunostained for tks5 (green) and cortactin (purple) and matrix degradation (black clearings). Arrows mark invadopodia. (E) Quantification of invadopodia number per cell in control and tks5 siRNA MDA-MB-231 cells plated in complete media. Mean ± SEM, T-test p<0.05. n=15 (ctrl), 27 (tks5) cells; 3 independent experiments. (F) Quantification of macrophage-induced in vitro intravasation when MDA-MB-231 cells treated with control siRNA, tks5 siRNA and GM6001 with and without macropahges. Mean ± SEM. n=10 (ctrl), 15 (ctrl+MΦ), 14 (Tks5), 14 (Tks5+MΦ), 11 (MMP inhib); 2 independent experiments for each. ANOVA p=1.4E-11. (G) Representative images of MDA-MB-231 treated with GM6001 for transendothelial cell crossing. X- views of transwells showing tumor cells (green) and endothelium (red), with cartoon depiction to the right. Dark clearing is filter (arrow).
Figure 5
Figure 5
Patient-derived breast tumor cells form invadopodia and contact macrophages during transendothelial migration. (A) TN1-GFP cells plated with and without macrophages (red) on 405-labelled gelatin coated dishes and immunostained with tks5 (red) and cortactin (white). Macrophage is labeled with CMPTX (red) and is marked by asterisk. Arrow marks invadopodium in TN1 cell in contact with macrophage. (B) As both the macrophage and tks5 immunostaining are in the same channel, GFP is used to specifically detect tumor cells (TN1-GFP). A dashed line outlines the macrophage (MΦ) and a solid line outlines the tumor cell (TC). (C) Zoomed image of tumor cell in (A) to reveal invadopodium (tks5 and cttn-positive) in TN1-GFP tumor cell (arrow). (D) Quantification of macrophage-induced invadodopdia in TN1-GFP cells. n=24 (Tn1 alone), 10 (TN1+MΦ) cells; 2 independent experiments. T-test p<0.05. (E) TN1-GFP cells plated on transendothelial migration transwells. Arrows marks areas of ZO-1 disassembly (white in left panel, purple in merge). (F) IMARIS 3D reconstruction of TN1 cell in (E) to show TN1-GFP (green) cell in z-axis penetrating through endothelium, as tight junctions (pink) are disassembling. (G) Z projection of same TN-1-GFP cell in (E) undergoing transendothelial migration (endothelium marked by white ZO-1 immunostaining in left panel, purple ZO-1 in merge in right panel) when contacting macrophages (red). (H) Cartoon depiction of macrophage-induced TN1-GFP transmigration in (G). (I) Quantification of TN1-GFP cells undergoing in vitro intravasation when in contact and not in contact with macrophages. n=7; 2 independent experiments.
Figure 6
Figure 6
Physical contact between macrophages and tumor cells at blood vessels correlates with increased invadopodium formation in vivo. (A) Immunostained sections from MDA-MB-231 orthotopic tumor. Cortactin (green) is enriched in tumor cell (cells indicated by DAPI, blue) in contact with macrophage (CD68, red) at blood vessel (CD31, white). White arrow marks tumor cell with increased cortactin intensity when in contact with macrophage. Red arrow marks tumor cell with absent cortactin immunostaining when not in contact with macrophage. (B) Quantification of % cortactin-positive cells at blood vessel when in contact and not in contact with macrophages. n=6 sections from 3 tumors.
Figure 7
Figure 7
Macrophages induce RhoA signaling in tumor cells to form invadopodia. (A) RhoA biosensor expressing MDA-MB-231 cell not in contact with macrophages. DIC panels (top) and FRET panels (bottom) reveal no global increase in RhoA activity nor protrusive structures. Time interval is indicated in minutes relative to macrophage addition. DIC panel corresponding to time 0 contains inset of TRITC to show absence of cell tracker red labeled macrophage. (B) RhoA biosensor expressing cell in contact with macrophage. DIC panels (top) reveals close association of macrophage and tumor cell. DIC panel corresponding to time 0 contains inset of TRITC to reveal cell tracker red labeled macrophage. FRET panels (bottom) show increased RhoA activity upon macrophage contact as well as multiple protrusions (white arrows). Time interval is indicated in minutes relative to macrophage addition. The pseudocolored scale in (A) and (B) represents ratio limits of black (1.0) to red (1.5) for RhoA activity. Scale bar is 10μm. (C) Quantification of RhoA biosensor activity in cells contacting macrophages (red) compared to cells not contacting macrophages (blue). Plotted is Mean ± SEM. Red arrow marks time in minutes when macrophages are added. n=12 (contact), 15 cells (no contact); 3 independent experiments. (D) RhoA biosensor expressing cells were imaged for 1 hour, and subsequently fixed and immunostained for cortactin and tks5. Asterisk in tks5 panel marks macrophage. Boxed area in images are shown on right to reveal punctae that are both tks5 and cortactin positive. (E) Quantification of invadopodium formation (tks5 and cortactin-positive structures) in RhoA biosensor-expressing cells that contact macrophages versus cells that do not contact macrophages. Plotted are all values, as well as mean ± SEM, T-test p<0.05. n=20 (no contact), 11 (contact); 2 independent experiments.

Similar articles

Cited by

References

    1. Roussos ET, Balsamo M, Alford SK, Wyckoff JB, Gligorijevic B, Wang Y, et al. Mena invasive (MenaINV) promotes multicellular streaming motility and transendothelial migration in a mouse model of breast cancer. Journal of cell science. 2011;124(Pt 13):2120–31. Epub 2011/06/15. - PMC - PubMed
    1. Wyckoff J, Wang W, Lin EY, Wang Y, Pixley F, Stanley ER, et al. A paracrine loop between tumor cells and macrophages is required for tumor cell migration in mammary tumors. Cancer research. 2004;64(19):7022–9. Epub 2004/10/07. - PubMed
    1. Wyckoff JB, Wang Y, Lin EY, Li JF, Goswami S, Stanley ER, et al. Direct visualization of macrophage-assisted tumor cell intravasation in mammary tumors. Cancer research. 2007;67(6):2649–56. Epub 2007/03/17. - PubMed
    1. Zervantonakis IK, Hughes-Alford SK, Charest JL, Condeelis JS, Gertler FB, Kamm RD. Three-dimensional microfluidic model for tumor cell intravasation and endothelial barrier function. Proceedings of the National Academy of Sciences of the United States of America. 2012;109(34):13515–20. Epub 2012/08/08. - PMC - PubMed
    1. Robinson BD, Sica GL, Liu YF, Rohan TE, Gertler FB, Condeelis JS, et al. Tumor microenvironment of metastasis in human breast carcinoma: a potential prognostic marker linked to hematogenous dissemination. Clinical cancer research : an official journal of the American Association for Cancer Research. 2009;15(7):2433–41. Epub 2009/03/26. - PMC - PubMed

Publication types

Substances