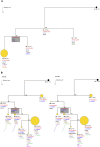
Single-cell mutational profiling and clonal phylogeny in cancer
- PMID: 24056532
- PMCID: PMC3847780
- DOI: 10.1101/gr.159913.113
Single-cell mutational profiling and clonal phylogeny in cancer
Abstract
The development of cancer is a dynamic evolutionary process in which intraclonal, genetic diversity provides a substrate for clonal selection and a source of therapeutic escape. The complexity and topography of intraclonal genetic architectures have major implications for biopsy-based prognosis and for targeted therapy. High-depth, next-generation sequencing (NGS) efficiently captures the mutational load of individual tumors or biopsies. But, being a snapshot portrait of total DNA, it disguises the fundamental features of subclonal variegation of genetic lesions and of clonal phylogeny. Single-cell genetic profiling provides a potential resolution to this problem, but methods developed to date all have limitations. We present a novel solution to this challenge using leukemic cells with known mutational spectra as a tractable model. DNA from flow-sorted single cells is screened using multiplex targeted Q-PCR within a microfluidic platform allowing unbiased single-cell selection, high-throughput, and comprehensive analysis for all main varieties of genetic abnormalities: chimeric gene fusions, copy number alterations, and single-nucleotide variants. We show, in this proof-of-principle study, that the method has a low error rate and can provide detailed subclonal genetic architectures and phylogenies.
Figures


Comment in
-
A superior strategy for single-cell mutational screening via multiplex-targeted QPCR using the BioMark HD microfluidic platform.Future Oncol. 2014 Mar;10(4):507-10. doi: 10.2217/fon.14.16. Future Oncol. 2014. PMID: 24754579
Similar articles
-
A superior strategy for single-cell mutational screening via multiplex-targeted QPCR using the BioMark HD microfluidic platform.Future Oncol. 2014 Mar;10(4):507-10. doi: 10.2217/fon.14.16. Future Oncol. 2014. PMID: 24754579
-
Subclonal Genomic Architectures of Primary and Metastatic Colorectal Cancer Based on Intratumoral Genetic Heterogeneity.Clin Cancer Res. 2015 Oct 1;21(19):4461-72. doi: 10.1158/1078-0432.CCR-14-2413. Epub 2015 May 15. Clin Cancer Res. 2015. PMID: 25979483
-
Assessing intratumor heterogeneity and tracking longitudinal and spatial clonal evolutionary history by next-generation sequencing.Proc Natl Acad Sci U S A. 2016 Sep 13;113(37):E5528-37. doi: 10.1073/pnas.1522203113. Epub 2016 Aug 29. Proc Natl Acad Sci U S A. 2016. PMID: 27573852 Free PMC article.
-
Principles of Reconstructing the Subclonal Architecture of Cancers.Cold Spring Harb Perspect Med. 2017 Aug 1;7(8):a026625. doi: 10.1101/cshperspect.a026625. Cold Spring Harb Perspect Med. 2017. PMID: 28270531 Free PMC article. Review.
-
Resolving genetic heterogeneity in cancer.Nat Rev Genet. 2019 Jul;20(7):404-416. doi: 10.1038/s41576-019-0114-6. Nat Rev Genet. 2019. PMID: 30918367 Review.
Cited by
-
Bulk Genotyping of Biopsies Can Create Spurious Evidence for Hetereogeneity in Mutation Content.PLoS Comput Biol. 2016 Apr 22;12(4):e1004413. doi: 10.1371/journal.pcbi.1004413. eCollection 2016 Apr. PLoS Comput Biol. 2016. PMID: 27105344 Free PMC article.
-
SeqClone: sequential Monte Carlo based inference of tumor subclones.BMC Bioinformatics. 2019 Jan 5;20(1):6. doi: 10.1186/s12859-018-2562-y. BMC Bioinformatics. 2019. PMID: 30611189 Free PMC article.
-
Clonal Evolution and Changes in Two AML Patients Detected with A Novel Single-Cell DNA Sequencing Platform.Sci Rep. 2019 Jul 31;9(1):11119. doi: 10.1038/s41598-019-47297-z. Sci Rep. 2019. PMID: 31366893 Free PMC article.
-
Nothing in cancer makes sense except….BMC Biol. 2018 Feb 21;16(1):22. doi: 10.1186/s12915-018-0493-8. BMC Biol. 2018. PMID: 29466995 Free PMC article. Review.
-
Homologue-specific chromosome sequencing characterizes translocation junctions and permits allelic assignment.DNA Res. 2018 Aug 1;25(4):353-360. doi: 10.1093/dnares/dsy007. DNA Res. 2018. PMID: 29518182 Free PMC article.
References
-
- Anderson K, Lutz C, van Delft FW, Bateman CM, Guo Y, Colman SM, Kempski H, Moorman AV, Titley I, Swansbury J, et al. 2011. Genetic variegation of clonal architecture and propagating cells in leukaemia. Nature 469: 356–361 - PubMed
-
- Bateman CM, Colman SM, Chaplin T, Young BD, Eden TO, Bhakta M, Gratias EJ, van Wering ER, Cazzaniga G, Harrison CJ, et al. 2010. Acquisition of genome-wide copy number alterations in monozygotic twins with acute lymphoblastic leukemia. Blood 115: 3553–3558 - PubMed
-
- Chin L, Andersen JN, Futreal PA 2011. Cancer genomics: From discovery science to personalized medicine. Nat Med 17: 297–303 - PubMed
Publication types
MeSH terms
Associated data
- Actions
LinkOut - more resources
Full Text Sources
Other Literature Sources
Molecular Biology Databases
Research Materials
