The next generation of transcription factor binding site prediction
- PMID: 24039567
- PMCID: PMC3764009
- DOI: 10.1371/journal.pcbi.1003214
The next generation of transcription factor binding site prediction
Abstract
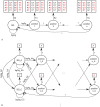
Finding where transcription factors (TFs) bind to the DNA is of key importance to decipher gene regulation at a transcriptional level. Classically, computational prediction of TF binding sites (TFBSs) is based on basic position weight matrices (PWMs) which quantitatively score binding motifs based on the observed nucleotide patterns in a set of TFBSs for the corresponding TF. Such models make the strong assumption that each nucleotide participates independently in the corresponding DNA-protein interaction and do not account for flexible length motifs. We introduce transcription factor flexible models (TFFMs) to represent TF binding properties. Based on hidden Markov models, TFFMs are flexible, and can model both position interdependence within TFBSs and variable length motifs within a single dedicated framework. The availability of thousands of experimentally validated DNA-TF interaction sequences from ChIP-seq allows for the generation of models that perform as well as PWMs for stereotypical TFs and can improve performance for TFs with flexible binding characteristics. We present a new graphical representation of the motifs that convey properties of position interdependence. TFFMs have been assessed on ChIP-seq data sets coming from the ENCODE project, revealing that they can perform better than both PWMs and the dinucleotide weight matrix extension in discriminating ChIP-seq from background sequences. Under the assumption that ChIP-seq signal values are correlated with the affinity of the TF-DNA binding, we find that TFFM scores correlate with ChIP-seq peak signals. Moreover, using available TF-DNA affinity measurements for the Max TF, we demonstrate that TFFMs constructed from ChIP-seq data correlate with published experimentally measured DNA-binding affinities. Finally, TFFMs allow for the straightforward computation of an integrated TF occupancy score across a sequence. These results demonstrate the capacity of TFFMs to accurately model DNA-protein interactions, while providing a single unified framework suitable for the next generation of TFBS prediction.
Conflict of interest statement
The authors have declared that no competing interests exist.
Figures


 % for at least one method (using a genomic background), the ratio between the AUC value using a specific model and the best AUC obtained is plotted. The four types of models were used (1st-order TFFM, detailed TFFM, PWM, and DWM). By considering a similar performance between two methods when the AUC ratio is
  %, we plot at the top of the figure the region where the weight matrices (WMs) best perform, where the TFFMs best perform, and where they are similar. AUC ratios are ranked from the least to the most favourable to the TFFMs.


Similar articles
-
High resolution models of transcription factor-DNA affinities improve in vitro and in vivo binding predictions.PLoS Comput Biol. 2010 Sep 9;6(9):e1000916. doi: 10.1371/journal.pcbi.1000916. PLoS Comput Biol. 2010. PMID: 20838582 Free PMC article.
-
Improving analysis of transcription factor binding sites within ChIP-Seq data based on topological motif enrichment.BMC Genomics. 2014 Jun 13;15(1):472. doi: 10.1186/1471-2164-15-472. BMC Genomics. 2014. PMID: 24927817 Free PMC article.
-
Application of experimentally verified transcription factor binding sites models for computational analysis of ChIP-Seq data.BMC Genomics. 2014 Jan 29;15(1):80. doi: 10.1186/1471-2164-15-80. BMC Genomics. 2014. PMID: 24472686 Free PMC article.
-
Building Transcription Factor Binding Site Models to Understand Gene Regulation in Plants.Mol Plant. 2019 Jun 3;12(6):743-763. doi: 10.1016/j.molp.2018.10.010. Epub 2018 Nov 15. Mol Plant. 2019. PMID: 30447332 Review.
-
An algorithmic perspective of de novo cis-regulatory motif finding based on ChIP-seq data.Brief Bioinform. 2018 Sep 28;19(5):1069-1081. doi: 10.1093/bib/bbx026. Brief Bioinform. 2018. PMID: 28334268 Review.
Cited by
-
A map of direct TF-DNA interactions in the human genome.Nucleic Acids Res. 2019 Feb 28;47(4):e21. doi: 10.1093/nar/gky1210. Nucleic Acids Res. 2019. PMID: 30517703 Free PMC article.
-
Transcription factor-DNA binding: beyond binding site motifs.Curr Opin Genet Dev. 2017 Apr;43:110-119. doi: 10.1016/j.gde.2017.02.007. Epub 2017 Mar 27. Curr Opin Genet Dev. 2017. PMID: 28359978 Free PMC article. Review.
-
The long noncoding RNA lnc-HLX-2-7 is oncogenic in Group 3 medulloblastomas.Neuro Oncol. 2021 Apr 12;23(4):572-585. doi: 10.1093/neuonc/noaa235. Neuro Oncol. 2021. PMID: 33844835 Free PMC article.
-
JASPAR 2024: 20th anniversary of the open-access database of transcription factor binding profiles.Nucleic Acids Res. 2024 Jan 5;52(D1):D174-D182. doi: 10.1093/nar/gkad1059. Nucleic Acids Res. 2024. PMID: 37962376 Free PMC article.
-
JASPAR 2014: an extensively expanded and updated open-access database of transcription factor binding profiles.Nucleic Acids Res. 2014 Jan;42(Database issue):D142-7. doi: 10.1093/nar/gkt997. Epub 2013 Nov 4. Nucleic Acids Res. 2014. PMID: 24194598 Free PMC article.
References
Publication types
MeSH terms
Substances
Grants and funding
LinkOut - more resources
Full Text Sources
Other Literature Sources
Miscellaneous

