. 2013 Oct 14;24(4):481-98.
doi: 10.1016/j.ccr.2013.08.012. Epub 2013 Sep 12.

An integrin-linked machinery of cytoskeletal regulation that enables experimental tumor initiation and metastatic colonization

Affiliations

An integrin-linked machinery of cytoskeletal regulation that enables experimental tumor initiation and metastatic colonization

Tsukasa Shibue et al. Cancer Cell. .

Erratum in

  • Cancer Cell. 2013 Dec 9;24(6):806-8

Abstract

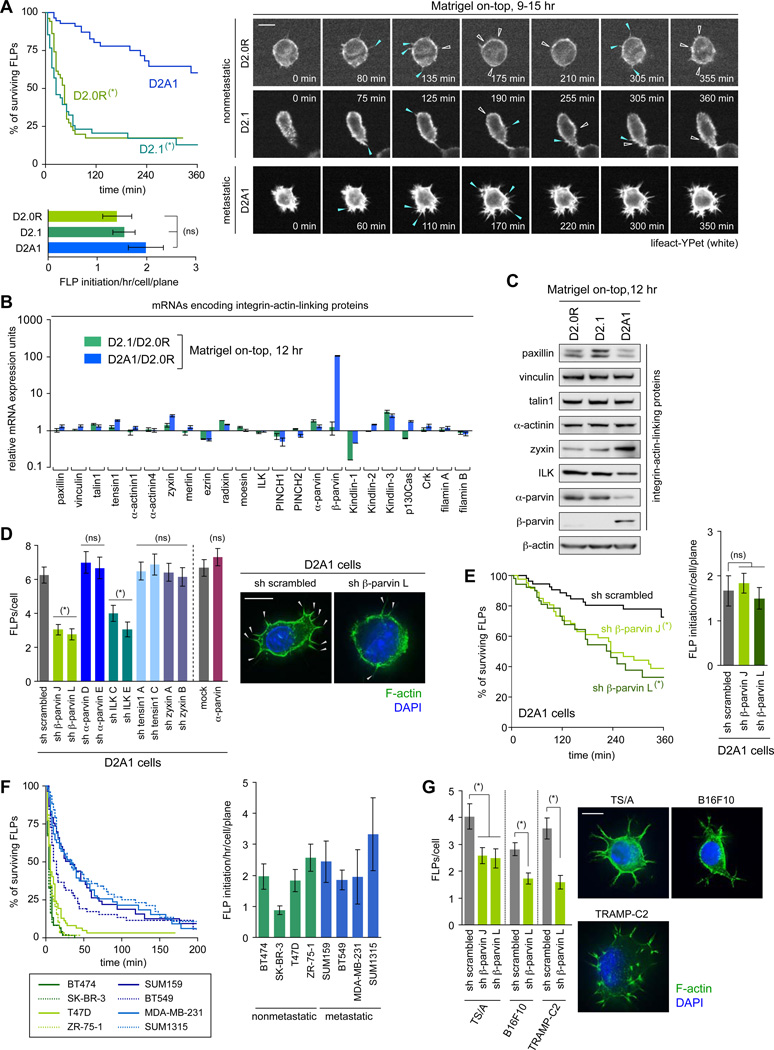
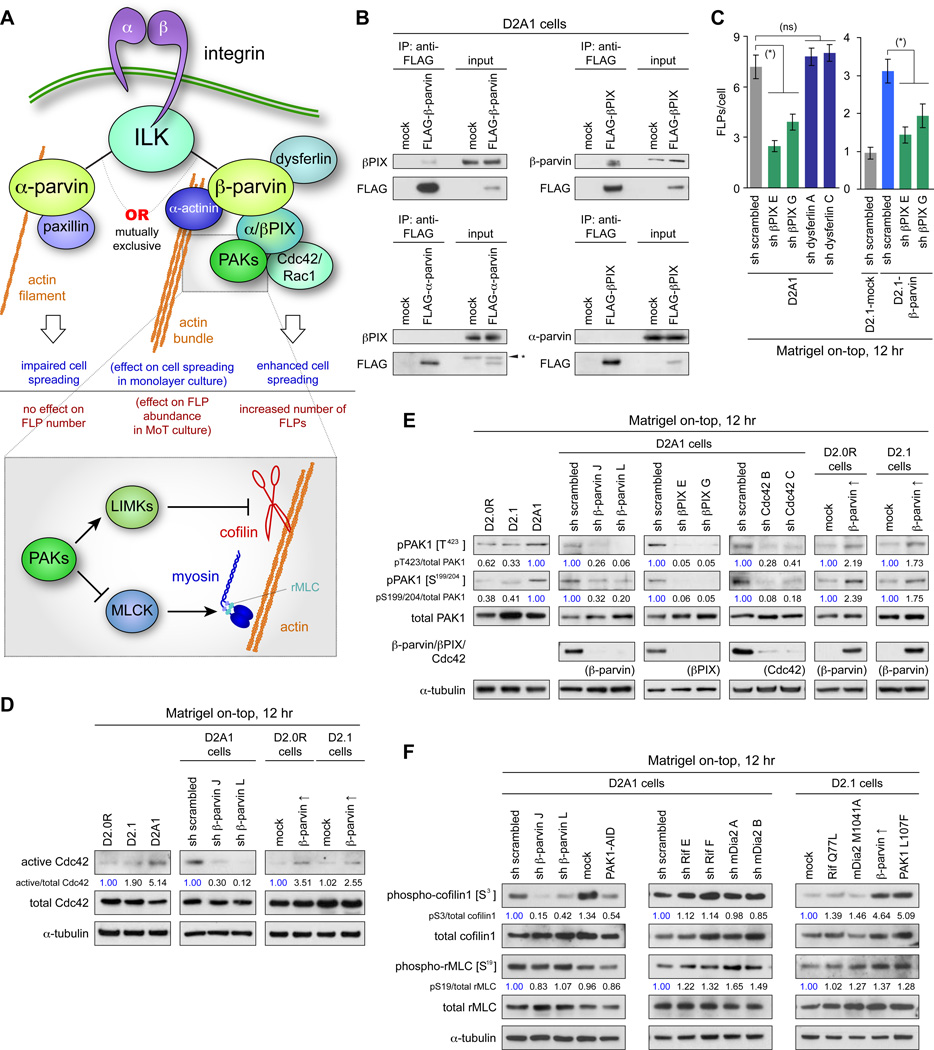
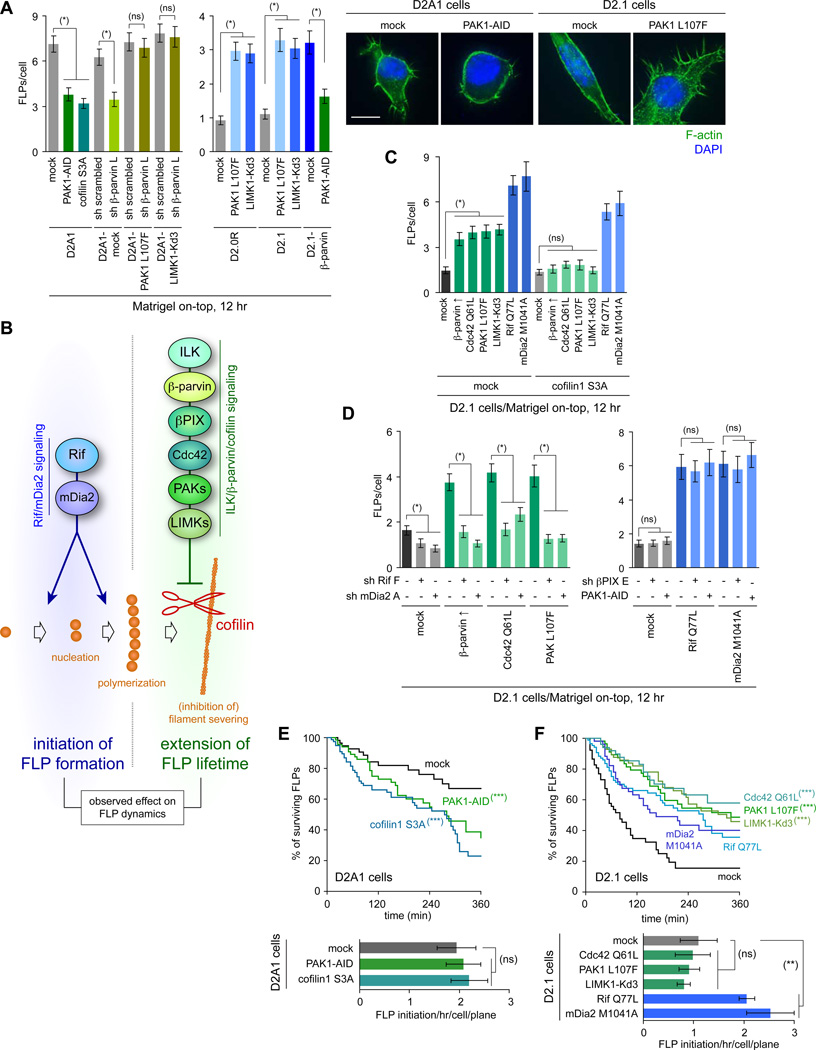
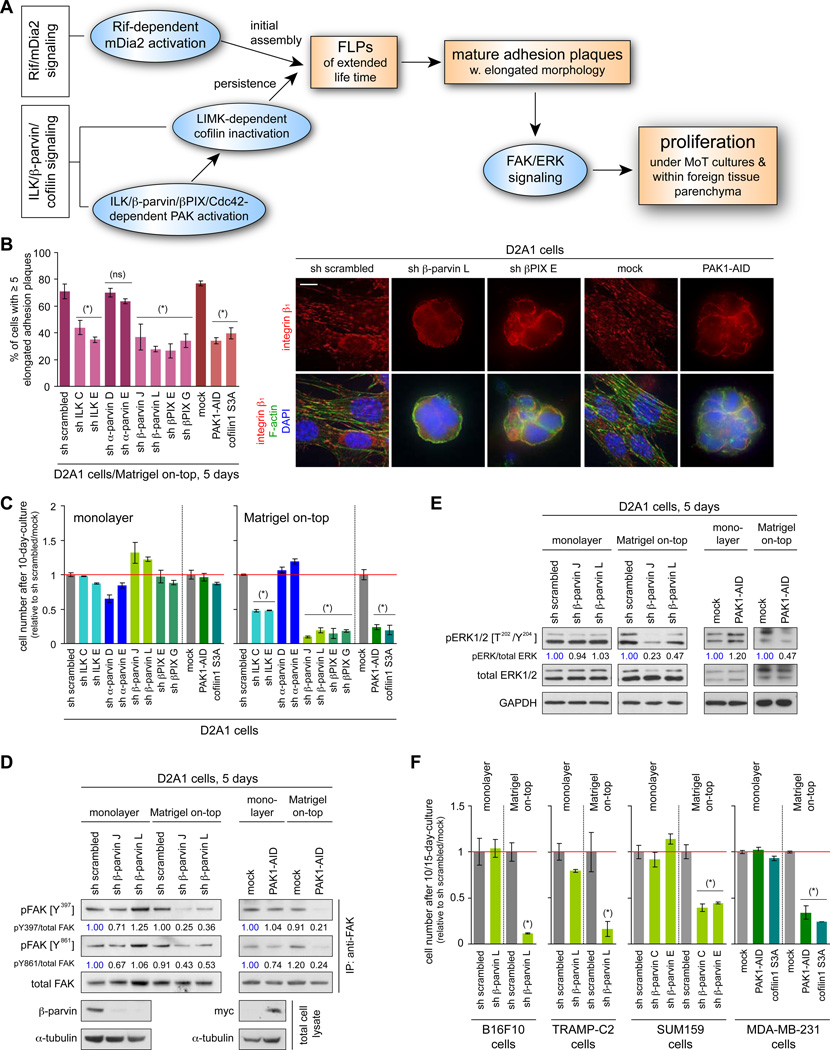
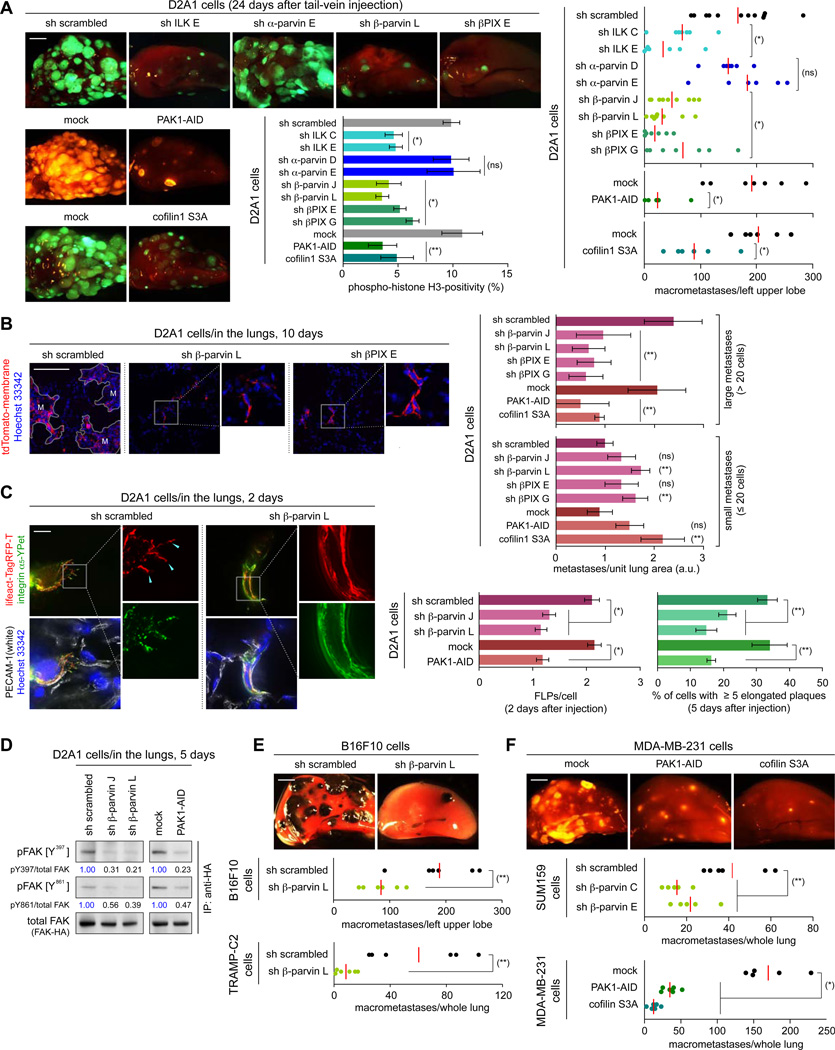
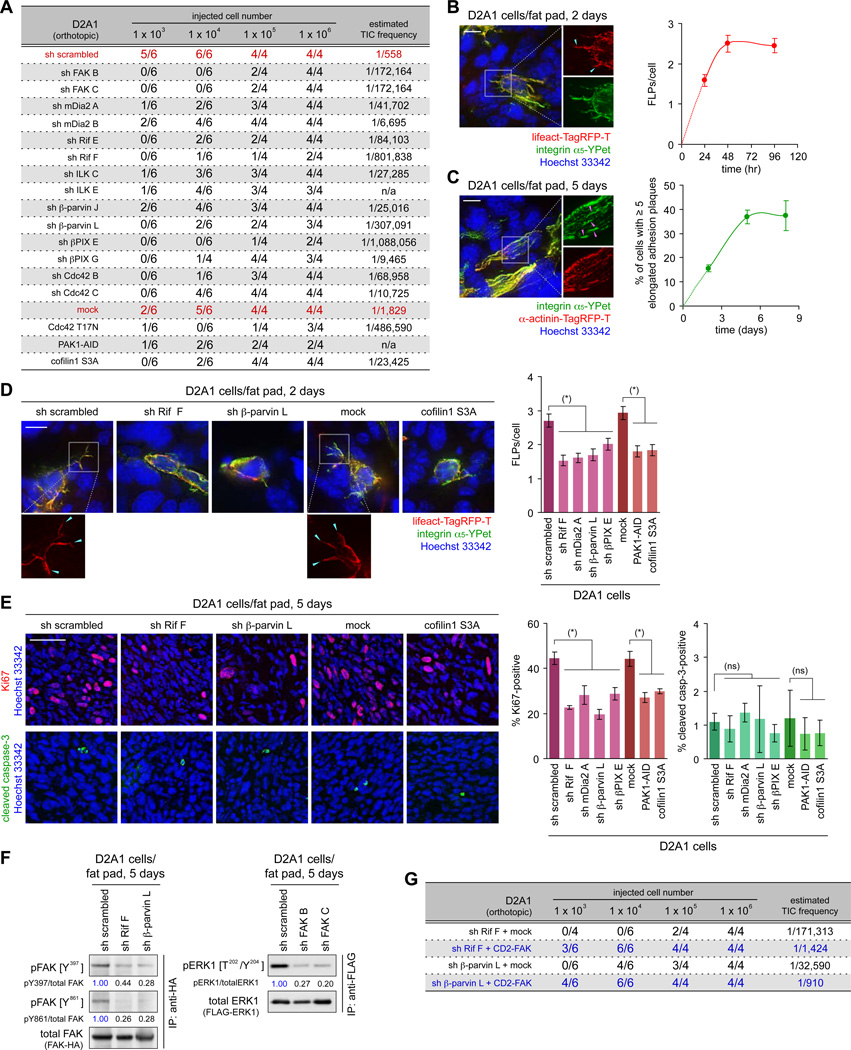
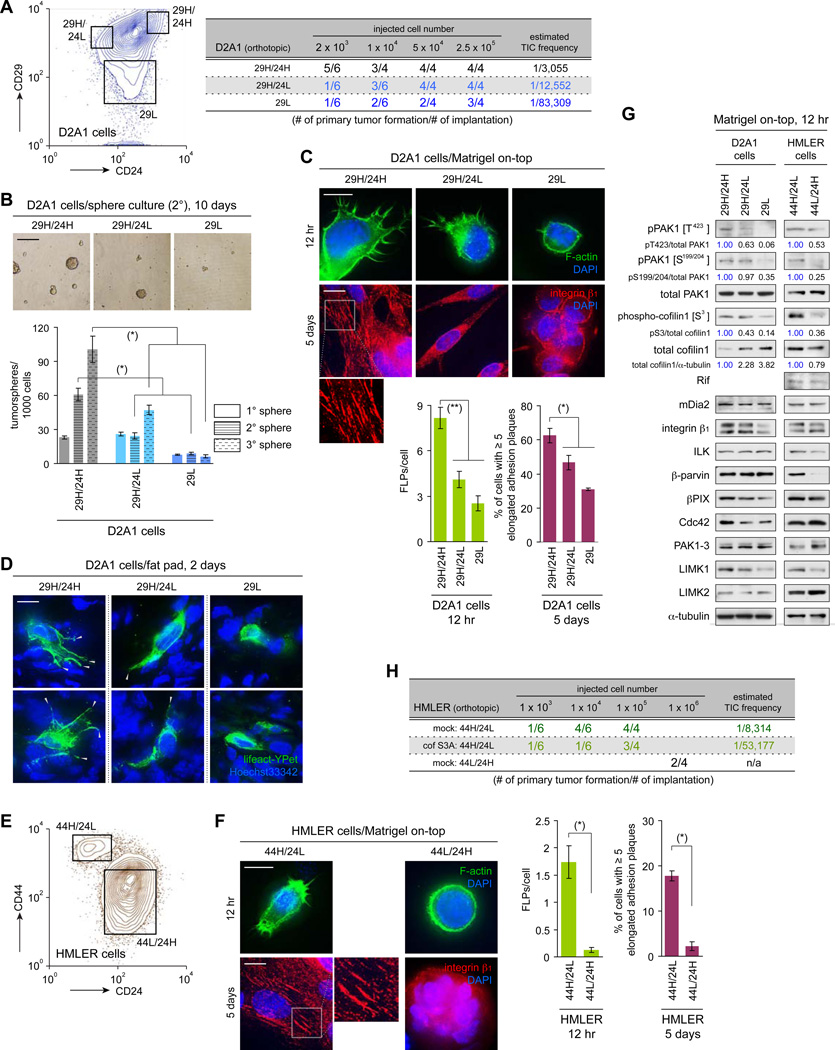
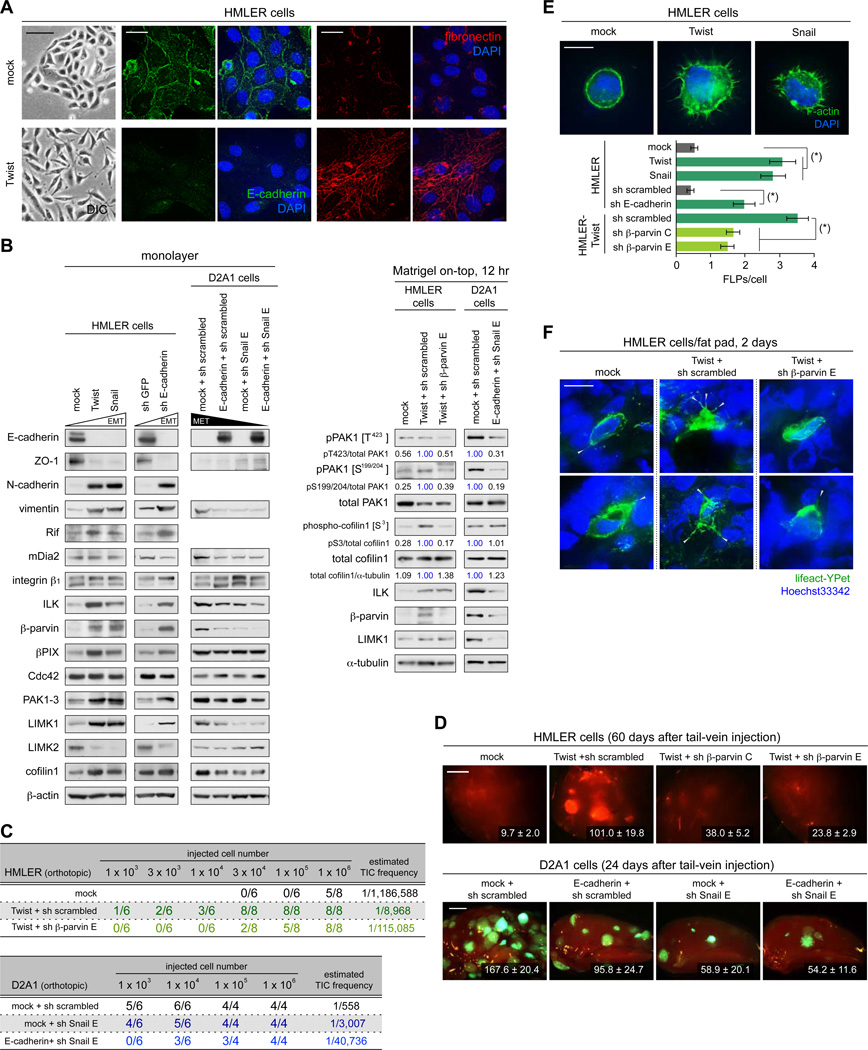
Recently extravasated metastatic cancer cells use the Rif/mDia2 actin-nucleating/polymerizing machinery in order to extend integrin β1-containing, filopodium-like protrusions (FLPs), which enable them to interact productively with the surrounding extracellular matrix; this process governs the initial proliferation of these cancer cells. Here, we identify the signaling pathway governing FLP lifetime, which involves integrin-linked kinase (ILK) and β-parvin, two integrin:actin-bridging proteins that block cofilin-mediated actin-filament severing. Notably, the combined actions of Rif/mDia2 and ILK/β-parvin/cofilin pathways on FLPs are required not only for metastatic outgrowth but also for primary tumor formation following experimental implantation. This provides one mechanistic explanation for how the epithelial-mesenchymal transition (EMT) program imparts tumor-initiating powers to carcinoma cells, since it enhances FLP formation through the activation of ILK/β-parvin/cofilin pathway.


Figures

Figure 1
Figure 1. β-parvin as a key regulator of FLP formation
(A) Kinetics of FLP assembly and disassembly. Three different D2 cell populations (expressing an actin marker lifeact-YPet) were analyzed by time-lapse microscopy. The appearance of new FLPs and the retraction of previously-present FLPs are marked by blue and open-white arrowheads, respectively. The periods of FLP persistence (top-left) and the rate of de novo FLP formation (bottom-left) were plotted. See also Movies S1–S3. (B, C) mRNA (B) and protein (C) expression for various integrin:actin-linkers. (D) Role of ILK/β-parvin in FLP formation. D2A1 cells with knockdowns for various integrin:actin-linkers or overexpression of α-parvin were propagated in MoT cultures and stained with phalloidin (F-actin; green) and DAPI (nuclei; blue) (right). The numbers of FLPs per cell were plotted (left). Knocking down the expression of β-parvin and ILK, but not the overexpression of α-parvin, reduced FLP abundance. Hence, the expression level of β-parvin, but not that of α-parvin, has a critical effect on FLP abundance. (E) Contribution of β-parvin to the extended FLP lifetime. The D2A1 cells manipulated as indicated (also expressing lifeact-YPet) were analyzed as in A. See also Movies S4, S5. (F) Persistence of FLPs formed by human breast cancer cells. Various human breast cancer cell lines (expressing lifeact-YPet) were analyzed by time-lapse microscopy for FLP persistence and the rate of de novo FLP formation. (G) β-parvin-dependent FLP formation in various metastatic cell types. Three metastatic mouse cell types were analyzed for FLP formation in MoT cultures. Values = means ± SD (n = 3: B) or means ± SEM (n ≒ 20: A, E, F; n = 100: D, G). Bars = 10 µm. In A and E, (*) p < 0.002 (by log-rank test; vs D2A1 in A, vs sh scrambled in E), (ns) p > 0.1. In D and G, (*) p < 0.01 (vs sh scrambled/mock), (ns) p > 0.3. See also Figure S1.
Figure 2
Figure 2. ILK/β-parvin/βPIX/Cdc42/PAK/LIMK/cofilin signaling in FLP formation
(A) Integrin-actin coupling by ILK/α-parvin and ILK/β-parvin complexes. α-parvin and β-parvin bind to ILK, each providing a link between integrins and actin cytoskeleton, while having different effects on cell behaviors. (B) β-parvin/βPIX interactions. Lysates from FLAG-β-parvin-, FLAG-α-parvin- or FLAG-βPIX-expressing cells were subjected to anti-FLAG immunoprecipitation and analyzed by immunoblotting. βPIX interacts with β-parvin, but not with α-parvin. (*) nonspecific bands. (C) Role of βPIX in FLP regulation. Knocking down the expression of βPIX, but not that of dysferlin (a transmembrane protein that interacts with β-parvin; Matsuda et al., 2005) reduced FLP abundance in the D2A1 cells. Values = means ± SEM (n = 100). (*) p < 0.001, (ns) p > 0.3. (D) β-parvin expression and Cdc42 activation. Values represent the intensities of the active Cdc42 bands relative to that of corresponding total Cdc42 band. (E) β-parvin/Cdc42/βPIX signaling in PAK phosphorylation. Here and in F, values represent the intensities of pPAK1 (phospho-cofilin1/phospho-rMLC) bands relative to that of the corresponding total PAK1 (cofilin1/rMLC) band. The blots are representative of multiple independent experiments. (F) Cofilin and rMLC phosphorylation in the downstream of β-parvin/PAK signaling. Bars = 10 µm. See also Figure S2.
Figure 3
Figure 3. Cooperation of Rif/mDia2 and ILK/β-parvin/cofilin pathways in FLP regulation
(A) Role of PAK/LIMK/cofilin axis in FLP regulation. Cells manipulated as indicated to alter the activity of PAK/LIMK/cofilin signaling were analyzed for FLP formation in MoT cultures. Bar = 10 µm. (B) Cooperation of the two signaling axes, Rif/mDia2 and ILK/β-parvin/cofilin, for abundant FLP display. (C) Differential requirement for cofilin inactivation between Rif/mDia2 and ILK/β-parvin/cofilin signaling pathways. The control (mock) and cofilin1 S3A-expressing D2.1 cells were further engineered to activate either of Rif/mDia2 or ILK/β-parvin/cofilin signaling pathways and analyzed for FLP formation. (D) Requirement for basal Rif/mDia2 activity in β-parvin/PAK-driven FLP formation. The D2.1 cells with enforced activation of ILK/β-parvin/cofilin signaling were further engineered to knockdown Rif or mDia2 expression (left), while those with enforced Rif/mDia2 activation were additionally engineered to knockdown βPIX or to overexpress PAK1-AID (right), before the FLP formation by these cells was analyzed. (E, F) Effects of signaling manipulation on FLP dynamics. D2A1 (E) and D2.1 (F) cells (expressing lifeact-YPet) were engineered to block and stimulate FLP formation, respectively, and analyzed by time-lapse microscopy. See also Movies S6–S8. Values = means ± SEM (n = 100: A, C, D; n ≒ 20: E, F). (*) p < 0.0001, (**) p < 0.05, (ns) p > 0.2 (by Student’s t-test). (***) p < 0.0001 (vs mock; by log-rank test). See also Figure S3.
Figure 4
Figure 4. in vitro effects of ILK/β-parvin/cofilin signaling manipulation
(A) Cell-biological and biochemical events that drive cell proliferation in MoT culture and within the lung parenchyma. (B, C) Role of ILK/β-parvin/cofilin signaling in adhesion plaque assembly and proliferation. The D2A1 cells were manipulated as indicated, with which the rate of mature adhesion plaque assembly in MoT culture (B) and the cell numbers after 10 days of monolayer or MoT culture (C) were determined. Bar = 10 µm. (D, E) β-parvin/PAK signaling and FAK/ERK activation. Values represent the intensities of pFAK (pERK) bands relative to that of the corresponding total FAK (ERK) band. (F) ILK/β-parvin/cofilin signaling and proliferation in various cell types. Indicated cell types were manipulated to block ILK/β-parvin/cofilin signaling, with which the cell numbers after 10 (15 for MDA-MB-231) days of monolayer/MoT cultures were determined. Values = means ± SD (n = 3: B, C, F). (*) p < 0.02, (ns) p > 0.1 (vs sh scrambled/mock). See also Figure S4.
Figure 5
Figure 5. in vivo effects of ILK/β-parvin/cofilin signaling manipulation
(A, B) ILK/β-parvin/cofilin signaling and metastatic colonization. The D2A1 cells expressing fluorescent markers (GFP or tdTomato; A, tdTomato-membrane; B) were manipulated as indicated and tail-vein injected. In A, representative lung images (left) and the numbers of macrometastases (right) 24 days after injection, as well as the phospho-histone H3 positivity of the cells residing in the lungs 7 days after injection (middle), were presented. Here and in E, F, the red bar represents the mean value within each sample group. In B, relative numbers of small (≤ 20 cells) and large metastases (> 20 cells) were quantified on the lung sections prepared 10 days after injection. M = large metastases. (C, D) β-parvin/PAK axis and in vivo cell-matrix adhesions. In C, the D2A1 cells expressing integrin α5-YPet (green) and lifeact-Tag-RFP-T (red), further engineered as indicated, were tail-vein injected. FLP formation was analyzed on the lung sections, where blood vessels (PECAM-1; white) and nuclei (Hoechst 33342; blue) were also visualized (left/middle). The formation of elongated adhesion plaques was scored similarly, except for using α-actinin-Tag-RFP-T fusion protein instead of lifeact-Tag-RFP-T (right). In D, the D2A1 cells engineered as indicated, also expressing FAK-HA, were tail-vein injected. 5 days later, FAK-HA was immunoprecipitated from the lung lysate and analyzed by immunoblotting. (E, F) Role of ILK/β-parvin/cofilin signaling in lung colonization by various cell types. The control and manipulated B16F10, TRAMP-C2, SUM159 and MDA-MB-231 cells, also expressing GFP (E) or tdTomato (F), were tail-vein injected and subsequent formation of lung metastases was analyzed. Values = means ± SD (n = 3: A [middle], B, C [right]); means ± SEM (n = 150: C [left]). Bars = 2 mm (A, E, F), 100 µm (B), 10 µm (C). (*) p < 0.005, (**) p < 0.05, (ns) p > 0.05 (vs sh scrambled/mock). See also Figure S5.
Figure 6
Figure 6. FLP formation and tumorigenesis of experimentally-implanted cells
(A) Role of FLP-regulating proteins in primary tumor formation. The D2A1 cells were engineered as indicated and implanted into the mammary fat pads. 28 days later, the formation of palpable tumors was scored, from which TIC frequency was calculated. (B, C) FLPs and elongated adhesion plaques formed by the mammary fat pad-implanted cells. The D2A1 cells expressing integrin α5-YPet (green) and either of the lifeact-Tag-RFP-T (red; B) or α-actinin-Tag-RFP-T (red; C) were implanted, together with non-labeled D2A1 cells. The formation of FLPs (blue arrowheads; B) and elongated adhesion plaques (pink arrowheads; C) was analyzed on the sections of the fat pads. (D, E) Effect of blocking FLP formation in the mammary fat pad-implanted cells. In D, fluorescent-labeled and non-labeled D2A1 cells, further manipulated as indicated, were mixed and implanted to analyze FLP formation within the mammary fat pads. In E, D2A1 cells were engineered as indicated and implanted. Proliferation and apoptosis of implanted cells were analyzed by staining the sections of the fat pads for Ki67 (red) and cleaved caspase-3 (green), respectively. (F) FAK/ERK activation in the mammary fat pad-implanted cells. The D2A1 cells expressing either of FAK-HA or FLAG-ERK1 were further manipulated as indicated and implanted. Subsequently, FAK-HA or FLAG-ERK1 was immunoprecipitated from the lysate of the fat pads and analyzed. (G) Restoring tumor-initiating ability by enforced FAK activation. The D2A1 cells with Rif or β-parvin knockdown were further manipulated to express the constitutively active CD2-FAK. Primary tumor formation by these and the control cells was analyzed. Bars = 10 µm (B-D), 100 µm (E). (*) p < 0.01, (ns) p > 0.1. See also Figure S6.
Figure 7
Figure 7. Display of abundant FLPs by cells of the TIC-enriched subpopulation
(A) Sorting of the D2A1 cells by CD29/CD24 expression. The cells of each subpopulation were implanted into mammary fad pads to score primary tumor formation (right). (B) Tumor sphere formation by the sorted D2A1 cells. Cells were sequentially passaged for the 3 rounds of 10-day culture. The numbers of tumorspheres after each round of culture were scored (bottom). Representative images of cells after the 2nd round of culture are also presented (top). (C, D) Formation of FLPs and elongated adhesion plaques by the sorted D2A1 cells. In C, sorted D2A1 cells were propagated in MoT cultures to analyze FLP/elongated adhesion plaque formation. In D, the D2A1 cells that did and did not express the fluorescent actin marker lifeact-YPet (green) were sorted, mixed and implanted. The formation of FLPs (gray arrowheads) by these cells was analyzed on the sections of the fat pads. (E) Sorting of the HMLER cells by CD44/CD24 expression. (F) Formation of FLPs and elongated adhesion plaques by the sorted HMLER cells in MoT cultures. (G) Expression of FLP-regulating proteins in cells of the various D2A1 and HMLER subpopulations. Cells of these subpopulations were propagated in MoT cultures and analyzed by immunoblotting. (H) Blocking ILK/β-parvin/cofilin signaling in the 44H/24L subpopulation of HMLER cells. HMLER cells were manipulated to express constitutively active cofilin1 S3A. These and the control cells were sorted and 44H/24L subpopulation obtained from each cell type was implanted to score primary tumor formation. Values = means ± SD (n = 3: B, C [right], F [right]); means ± SEM (n = 100: C [left], F [left]). Bars = 200 µm (B), 10 µm (C, D, F). (*) p < 0.005, (**) p < 0.02. See also Figure S7.
Figure 8
Figure 8. Functional connection between FLP formation and EMT program
(A) Twist-induced EMT in the HMLER cells. The control (mock) and Twist-expressing HMLER cells were propagated as a monolayer and stained for E-cadherin (green), fibronectin (red) and the nuclei (blue) (right). Differential interference contrast (DIC) images of these cells are also presented (left). (B) Changes in the expression levels of EMT-markers and FLP-regulators. HMLER cells and D2A1 cells were engineered as indicated to undergo an EMT and MET, respectively. These and the control cells were propagated either as a monolayer (left) or in MoT cultures (right) and analyzed by immunoblotting. (C, D) Effect of EMT/MET on primary tumor formation and metastatic colonization. In C, indicated cell types were mammary fat pad-implanted and primary tumor formation was scored. In D, indicated cells types, also expressing GFP or tdTomato, were tail-vein injected to score metastasis formation in the lungs. The numbers of macrometastases observed on the surface of the entire lungs (HMLER) or left upper lobe of the lungs (D2A1) are presented. (E, F) FLP formation before and after EMT induction. In E, the HMLER cells engineered as indicated were analyzed for FLP formation in MoT culture. (*) p < 1 × 10⁻⁵. In F, HMLER cells engineered as indicated were further manipulated to express lifeact-YPet. These and non-labeled cells were mixed and fad pad-implanted to score the formation of FLPs (gray arrowheads). Values = means ± SEM (n ≥ 5: D, n = 100: E). Bars = 100 µm (A [left]), 20 µm (A [right]), 2 mm (D), 10 µm (E, F). See also Figure S8.

Similar articles

Cited by

References

    1. Aguirre Ghiso JA, Kovalski K, Ossowski L. Tumor dormancy induced by downregulation of urokinase receptor in human carcinoma involves integrin and MAPK signaling. J Cell Biol. 1999;147:89–104. - PMC - PubMed
    1. Barkan D, Kleinman H, Simmons JL, Asmussen H, Kamaraju AK, Hoenorhoff MJ, Liu ZY, Costes SV, Cho EH, Lockett S, et al. Inhibition of metastatic outgrowth from single dormant tumor cells by targeting the cytoskeleton. Cancer Res. 2008;68:6241–6250. - PMC - PubMed
    1. Bokoch GM. Biology of the p21-activated kinases. Annu Rev Biochem. 2003;72:743–781. - PubMed
    1. Chambers AF, Groom AC, MacDonald IC. Dissemination and growth of cancer cells in metastatic sites. Nat Rev Cancer. 2002;2:563–572. - PubMed
    1. Clevers H. The cancer stem cell: premises, promises and challenges. Nat Med. 2011;17:313–319. - PubMed

Publication types