Micromechanical mapping of early osteoarthritic changes in the pericellular matrix of human articular cartilage
- PMID: 24025318
- PMCID: PMC3856176
- DOI: 10.1016/j.joca.2013.08.026
Micromechanical mapping of early osteoarthritic changes in the pericellular matrix of human articular cartilage
Abstract
Objective: Osteoarthritis (OA) is a degenerative joint disease characterized by the progressive loss of articular cartilage. While macroscale degradation of the cartilage extracellular matrix (ECM) has been extensively studied, microscale changes in the chondrocyte pericellular matrix (PCM) and immediate microenvironment with OA are not fully understood. The objective of this study was to quantify osteoarthritic changes in the micromechanical properties of the ECM and PCM of human articular cartilage in situ using atomic force microscopy (AFM).
Method: AFM elastic mapping was performed on cryosections of human cartilage harvested from both condyles of macroscopically normal and osteoarthritic knee joints. This method was used to test the hypotheses that both ECM and PCM regions exhibit a loss of mechanical properties with OA and that the size of the PCM is enlarged in OA cartilage as compared to normal tissue.
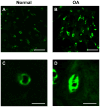
Results: Significant decreases were observed in both ECM and PCM moduli of 45% and 30%, respectively, on the medial condyle of OA knee joints as compared to cartilage from macroscopically normal joints. Enlargement of the PCM, as measured biomechanically, was also observed in medial condyle OA cartilage, reflecting the underlying distribution of type VI collagen in the region. No significant differences were observed in elastic moduli or their spatial distribution on the lateral condyle between normal and OA joints.
Conclusion: Our findings provide new evidence of significant site-specific degenerative changes in the chondrocyte micromechanical environment with OA.
Keywords: Atomic force microscopy; Chondron; Proteoglycan; Scanning probe microscopy; Type VI collagen.
Copyright © 2013 Osteoarthritis Research Society International. Published by Elsevier Ltd. All rights reserved.
Conflict of interest statement
None to declare.
Figures


Similar articles
-
Depth-dependent anisotropy of the micromechanical properties of the extracellular and pericellular matrices of articular cartilage evaluated via atomic force microscopy.J Biomech. 2013 Feb 1;46(3):586-92. doi: 10.1016/j.jbiomech.2012.09.003. Epub 2012 Oct 11. J Biomech. 2013. PMID: 23062866 Free PMC article.
-
A biomechanical role for perlecan in the pericellular matrix of articular cartilage.Matrix Biol. 2012 Jul;31(6):320-7. doi: 10.1016/j.matbio.2012.05.002. Epub 2012 May 30. Matrix Biol. 2012. PMID: 22659389 Free PMC article.
-
Immunofluorescence-guided atomic force microscopy to measure the micromechanical properties of the pericellular matrix of porcine articular cartilage.J R Soc Interface. 2012 Nov 7;9(76):2997-3007. doi: 10.1098/rsif.2012.0314. Epub 2012 Jun 6. J R Soc Interface. 2012. PMID: 22675162 Free PMC article.
-
The structure and function of the pericellular matrix of articular cartilage.Matrix Biol. 2014 Oct;39:25-32. doi: 10.1016/j.matbio.2014.08.009. Epub 2014 Aug 27. Matrix Biol. 2014. PMID: 25172825 Free PMC article. Review.
-
The pericellular matrix as a transducer of biomechanical and biochemical signals in articular cartilage.Ann N Y Acad Sci. 2006 Apr;1068:498-512. doi: 10.1196/annals.1346.011. Ann N Y Acad Sci. 2006. PMID: 16831947 Review.
Cited by
-
Perlecan in Pericellular Mechanosensory Cell-Matrix Communication, Extracellular Matrix Stabilisation and Mechanoregulation of Load-Bearing Connective Tissues.Int J Mol Sci. 2021 Mar 8;22(5):2716. doi: 10.3390/ijms22052716. Int J Mol Sci. 2021. PMID: 33800241 Free PMC article. Review.
-
Selective Enzymatic Digestion of Proteoglycans and Collagens Alters Cartilage T1rho and T2 Relaxation Times.Ann Biomed Eng. 2019 Jan;47(1):190-201. doi: 10.1007/s10439-018-02143-7. Epub 2018 Oct 4. Ann Biomed Eng. 2019. PMID: 30288634 Free PMC article.
-
Identification of ageing-associated naturally occurring peptides in human urine.Oncotarget. 2015 Oct 27;6(33):34106-17. doi: 10.18632/oncotarget.5896. Oncotarget. 2015. PMID: 26431327 Free PMC article.
-
Alteration in cartilage matrix stiffness as an indicator and modulator of osteoarthritis.Biosci Rep. 2024 Jan 31;44(1):BSR20231730. doi: 10.1042/BSR20231730. Biosci Rep. 2024. PMID: 38014522 Free PMC article.
-
Collagen Type IV and Laminin Expressions during Cartilage Repair and in Late Clinically Failed Repair Tissues from Human Subjects.Cartilage. 2016 Jan;7(1):52-61. doi: 10.1177/1947603515604022. Cartilage. 2016. PMID: 26958317 Free PMC article.
References
-
- Poole AR, Guilak F, Abramson SA. Etiopathogenesis of Osteoarthritis. In: Moskowitz RW, Altman RD, Hochberg MC, Buckwalter JA, Goldberg VM, editors. Osteoarthritis: Diagnosis and Medical/Surgical Management. Philadelphia, PA: Lippincott, Williams & Wilkins; 2007. pp. 27–49.
-
- Goldring SR. The role of bone in osteoarthritis pathogenesis. Rheum Dis Clin North Am. 2008;34:561–571. - PubMed
-
- Poole CA, Gilbert RT, Herbage D, Hartmann DJ. Immunolocalization of type IX collagen in normal and spontaneously osteoarthritic canine tibial cartilage and isolated chondrons. Osteoarthritis Cartilage. 1997;5:191–204. - PubMed
Publication types
MeSH terms
Substances
Grants and funding
LinkOut - more resources
Full Text Sources
Other Literature Sources
Miscellaneous

