

Three-dimensional quantification of cellular traction forces and mechanosensing of thin substrata by fourier traction force microscopy
- PMID: 24023712
- PMCID: PMC3762859
- DOI: 10.1371/journal.pone.0069850
Three-dimensional quantification of cellular traction forces and mechanosensing of thin substrata by fourier traction force microscopy
Abstract
We introduce a novel three-dimensional (3D) traction force microscopy (TFM) method motivated by the recent discovery that cells adhering on plane surfaces exert both in-plane and out-of-plane traction stresses. We measure the 3D deformation of the substratum on a thin layer near its surface, and input this information into an exact analytical solution of the elastic equilibrium equation. These operations are performed in the Fourier domain with high computational efficiency, allowing to obtain the 3D traction stresses from raw microscopy images virtually in real time. We also characterize the error of previous two-dimensional (2D) TFM methods that neglect the out-of-plane component of the traction stresses. This analysis reveals that, under certain combinations of experimental parameters (cell size, substratums' thickness and Poisson's ratio), the accuracy of 2D TFM methods is minimally affected by neglecting the out-of-plane component of the traction stresses. Finally, we consider the cell's mechanosensing of substratum thickness by 3D traction stresses, finding that, when cells adhere on thin substrata, their out-of-plane traction stresses can reach four times deeper into the substratum than their in-plane traction stresses. It is also found that the substratum stiffness sensed by applying out-of-plane traction stresses may be up to 10 times larger than the stiffness sensed by applying in-plane traction stresses.
Conflict of interest statement
Figures
 –pixel
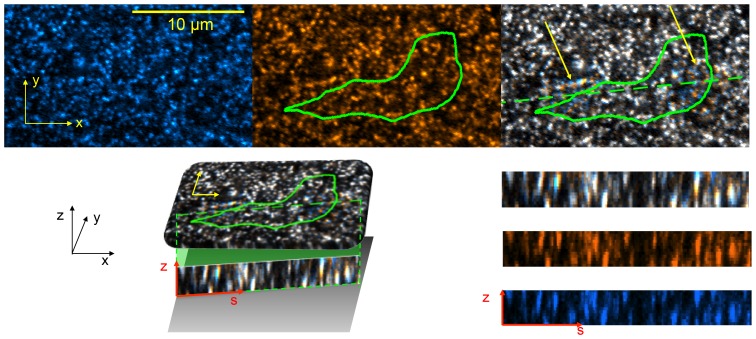
  stack, which is focused at the free surface of the substratum (
 ). (
a
), Tracer beads fluorescence in undeformed conditions used as reference for traction force microscopy. The scale bar is 10 microns long. The axes indicate the reference system for both the substratum deformation and the traction stresses. (
b
), Tracer beads fluorescence when the substratum is deformed by a migrating cell, whose outline is indicated by the green contour. (
c
), Image obtained by merging the fluorescence from tracer beads in undeformed (a) and deformed (b) conditions, which reveals the deformation of the substratum. White speckles indicate perfect match between undeformed and deformed conditions and thus zero local deformation. Blue and orange speckles indicate mismatch between undeformed and deformed conditions and thus non-zero local deformation. Regions of locally large deformation are indicated with yellow arrows. The dashed green line indicates the location of the vertical section shown in panels d–g. (
d
), Three-dimensional illustration of the relative positions of the horizontal plane in panel (x–y, yellow axes) and the vertical plane in panel (s–z, red axes). The black axes indicate the three-dimensional reference system used to express both the substratum deformation and the traction stresses. The three panels at the bottom right corner of the figure (e–g) show vertical slices of the same
). (
a
), Tracer beads fluorescence in undeformed conditions used as reference for traction force microscopy. The scale bar is 10 microns long. The axes indicate the reference system for both the substratum deformation and the traction stresses. (
b
), Tracer beads fluorescence when the substratum is deformed by a migrating cell, whose outline is indicated by the green contour. (
c
), Image obtained by merging the fluorescence from tracer beads in undeformed (a) and deformed (b) conditions, which reveals the deformation of the substratum. White speckles indicate perfect match between undeformed and deformed conditions and thus zero local deformation. Blue and orange speckles indicate mismatch between undeformed and deformed conditions and thus non-zero local deformation. Regions of locally large deformation are indicated with yellow arrows. The dashed green line indicates the location of the vertical section shown in panels d–g. (
d
), Three-dimensional illustration of the relative positions of the horizontal plane in panel (x–y, yellow axes) and the vertical plane in panel (s–z, red axes). The black axes indicate the three-dimensional reference system used to express both the substratum deformation and the traction stresses. The three panels at the bottom right corner of the figure (e–g) show vertical slices of the same  –stack passing through the dashed green line in panel at
  . (
e
), Image obtained by merging the fluorescence from tracer beads in undeformed (f) and deformed (g) conditions. Speckle patterns with orange top and blue bottom are found in locations where the cell is pulling up on the substratum. Conversely, speckle patterns with blue top and orange bottom are found the when cell is pushing down on the substratum. (
f
), Tracer beads fluorescence in deformed condition. (
g
), Tracer beads fluorescence in underformed condition.
. (
e
), Image obtained by merging the fluorescence from tracer beads in undeformed (f) and deformed (g) conditions. Speckle patterns with orange top and blue bottom are found in locations where the cell is pulling up on the substratum. Conversely, speckle patterns with blue top and orange bottom are found the when cell is pushing down on the substratum. (
f
), Tracer beads fluorescence in deformed condition. (
g
), Tracer beads fluorescence in underformed condition.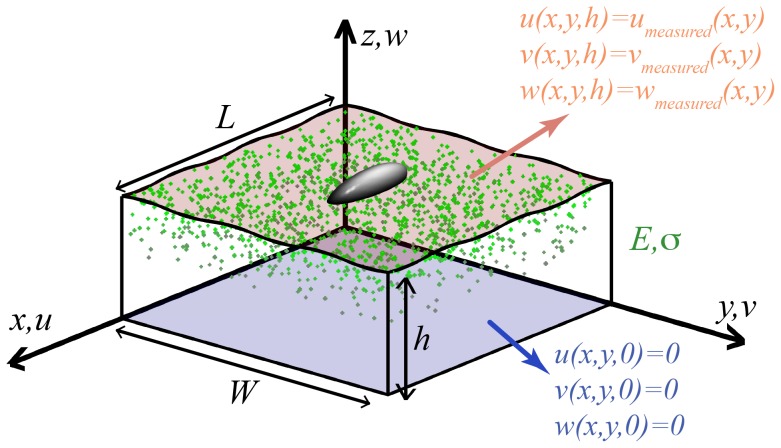
 , red), and it is assumed that the deformation of the substratum is zero at the bottom surface in contact with the glass coverslip (
 , blue). We assume that the substratum has linear, homogeneous, isotropic material properties, with Young modulus E and Poisson's ratio σ. Fourier series with spatial periods L and W are used to express the dependence of the variables in the horizontal directions.
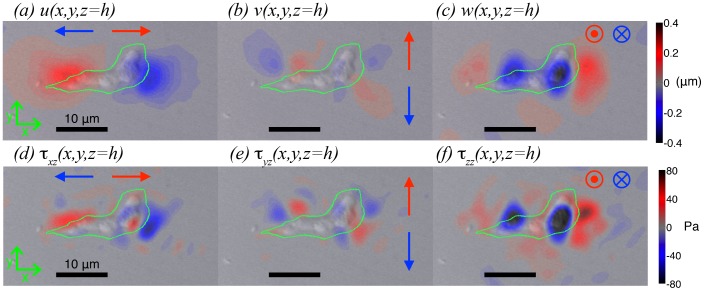
 2.4). The black scale bars are
  long. (
a
), Tangential (horizontal) deformation in the direction parallel to cell speed,
long. (
a
), Tangential (horizontal) deformation in the direction parallel to cell speed,  . (
b
), Tangential (horizontal) deformation in the direction perpendicular to cell speed,
. (
b
), Tangential (horizontal) deformation in the direction perpendicular to cell speed,  . (
c
), Normal (vertical) deformation,
. (
c
), Normal (vertical) deformation,  . (
d
), Tangential (horizontal) stress in the direction parallel to cell speed,
. (
d
), Tangential (horizontal) stress in the direction parallel to cell speed,  . (e), Tangential (horizontal) stress in the direction perpendicular to cell speed,
  . (f), Normal (vertical) stress,
  . The arrows in panels , , and indicate the directions of positive (red) and negative (blue) deformation/stress. The
  and
and  symbols in panels and indicate deformation/stress pointing respectively into the plane (blue, negative) and out of the plane (red, positive).
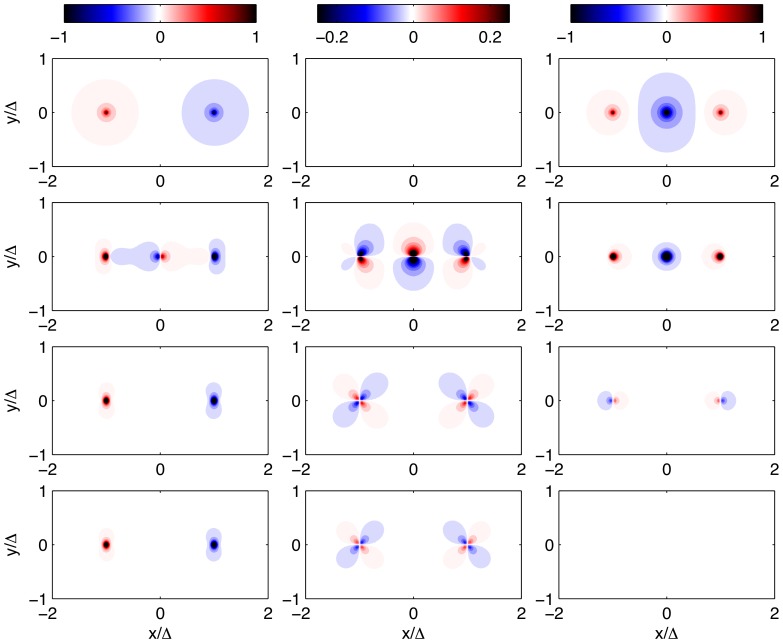
 and the substratum thickness,
  , is equal to the length of the “synthetic cell”. The plots in the top row show the synthetic deformation field in the x direction (eq. 11, panel a), y direction (zero, panel b) and z direction (eq. 13, panel c). The second row shows the traction stresses calculated from the displacements in panels (a)–(c) by 3D Fourier TFM. (d),
  ; (e),
  ; (f),
  . The third row shows the traction stresses calculated from the displacements in panels (a)–(c) by 2D Fourier TFM under the assumption of zero normal displacements on the substratum's surface (
 as in ref. [15]). (g),
  ; (h),
  ; (i),
  . The last row shows the traction stresses calculated from the displacements in panels (a)–(c) by 2D Fourier TFM under the assumption of zero normal stresses on the substratum's surface (
 as in ref. [13]). (j),
  ; (k),
  ; (l),
  .
.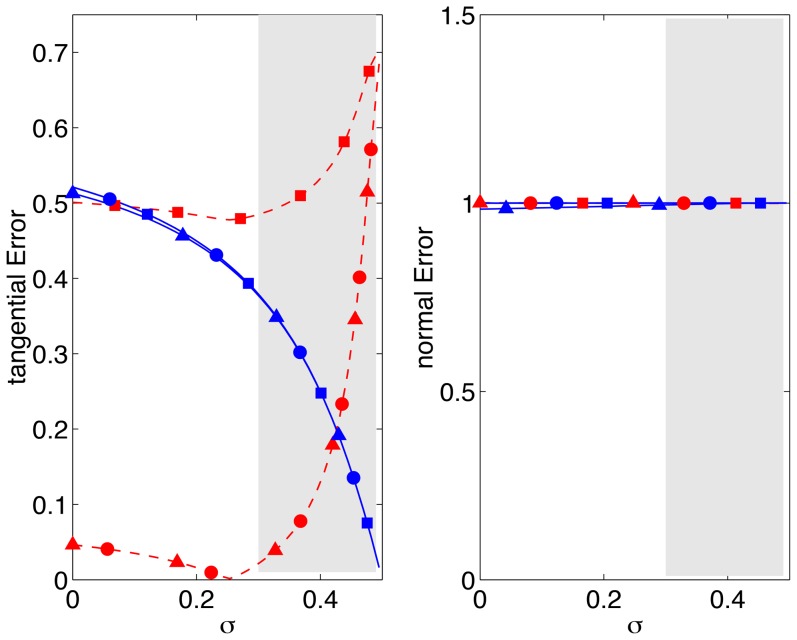
 . Red lines and symbols,
  ; blue lines and symbols,
  .–•–, 2D method with finite h and
  on the surface (ref. [13]);–▴–, 2D method with finite h and
  on the surface (ref. [15]);–▪–, Boussinesq solution with infinite h (refs. [10], [12]). (a),
  ; (b),
  . The shaded patch represents the range of values of Poisson's ratio reported for gels customarily employed in TFM –.
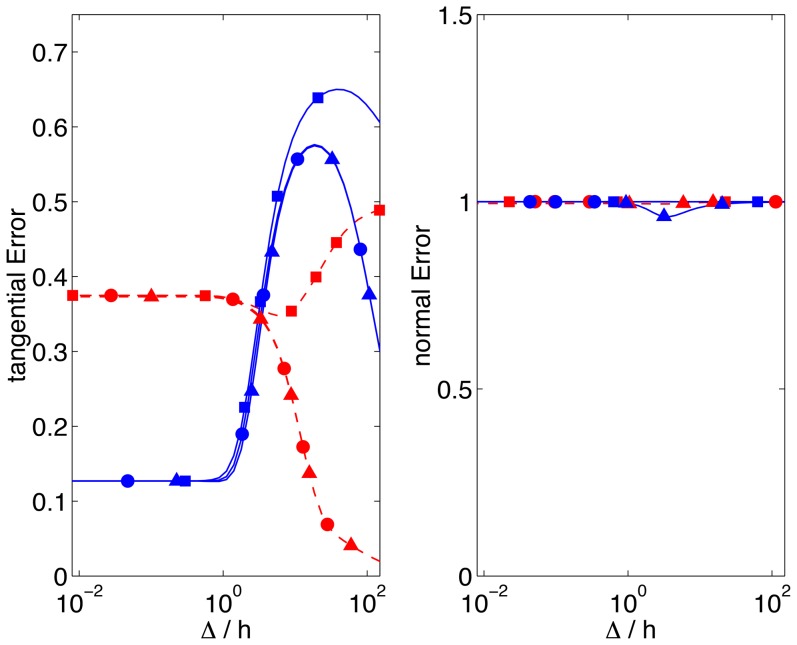
 ; blue lines and symbols,
  .–•–, 2D method with finite h and
  on the surface (ref. [13]);–▴–, 2D method with finite h and
  on the surface (ref. [15]);–▪–, Boussinesq solution with infinite h (refs. [10], [12]).
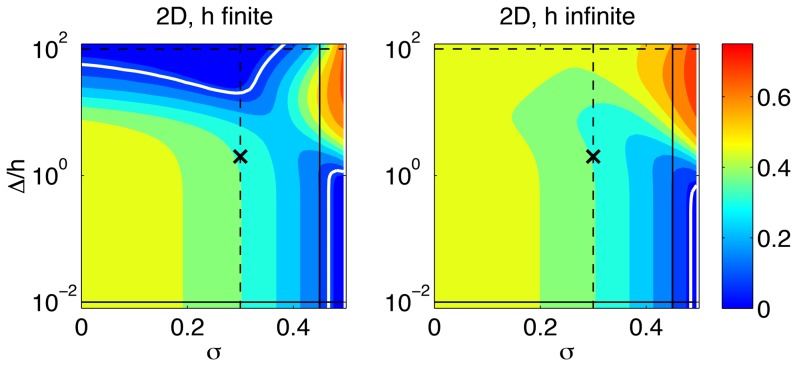
 assuming zero normal deformation on the surface of the substratum; (b),
  from Boussinesq's solution. The black×marks the combination of σ and
  used to calculate the traction stress maps in Figure 4. The horizontal lines mark the values of
  used to plot Figure 5.–––,
  ;– – –,
  . The thick white contours correspond to
  . The vertical lines mark the values of σ used to plot Figure 6.– – –,
  ;––––,
  .
.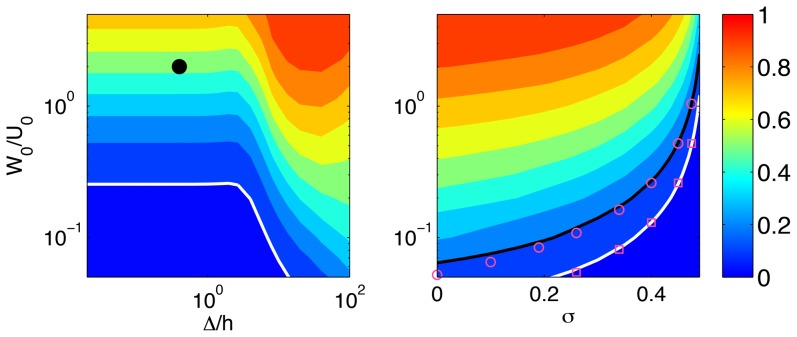
 for
for  , represented as a function of
  and
and  . The black circle corresponds to the example cell in Figure 3. The thick white contour corresponds to
  . (b), contour map of
  for
for  , represented as a function of σ and
  . The thick white (black) contours correspond to
  (0.2), and are well approximated by the magenta squares (circles) coming the eq. 19.
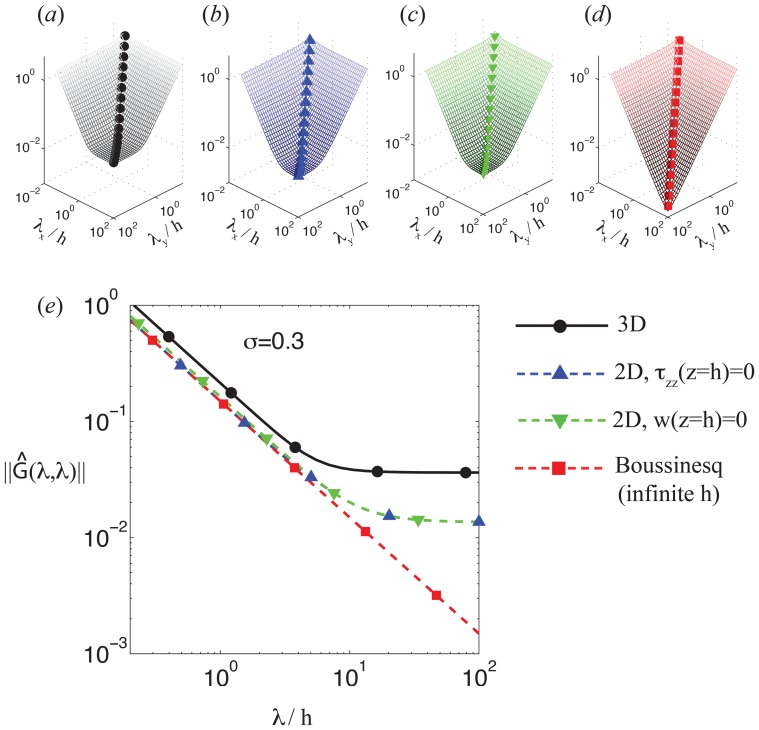
 as a function of the horizontal wavelengths of the strain/stress fields
  .(
a
), present 3D TFM method;(
b
), 2D TFM under the assumption of zero normal stresses on the substratum's surface (
.(
a
), present 3D TFM method;(
b
), 2D TFM under the assumption of zero normal stresses on the substratum's surface ( as in ref. [13]);(
c
), 2D TFM under the assumption of zero normal displacements on the substratum's surface (
as in ref. [13]);(
c
), 2D TFM under the assumption of zero normal displacements on the substratum's surface ( as in ref. [15]);(
d
), Boussinesq's traction cytometry assuming an infinitely-thick substratum (as in refs. [10], [12]). The symbol curves in these plots indicate the sections of
as in ref. [15]);(
d
), Boussinesq's traction cytometry assuming an infinitely-thick substratum (as in refs. [10], [12]). The symbol curves in these plots indicate the sections of  represented in panel (e).(
e
),
represented in panel (e).(
e
),  along the line
  from different traction TFM methods, represented as a function of
  .
.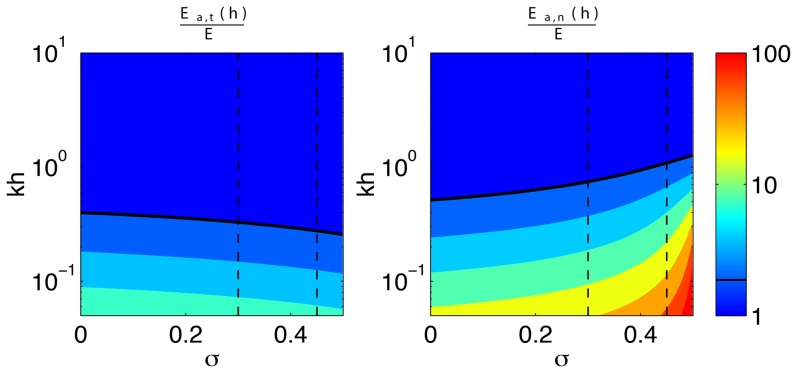
 of the strain/stress fields. For simplicity, the
  case is represented but similar results are obtained for other combinations of the wavenumbers. The isolines plotted in panels (a) and (b) are respectively
  , and
, and  . Particularly, the The thick black contour in each panel represents the isoline
  corresponding to a two-fold increase in apparent stiffness. The vertical dashed lines indicate the values of the Poisson's ratio represented in Figure 11,
  .
.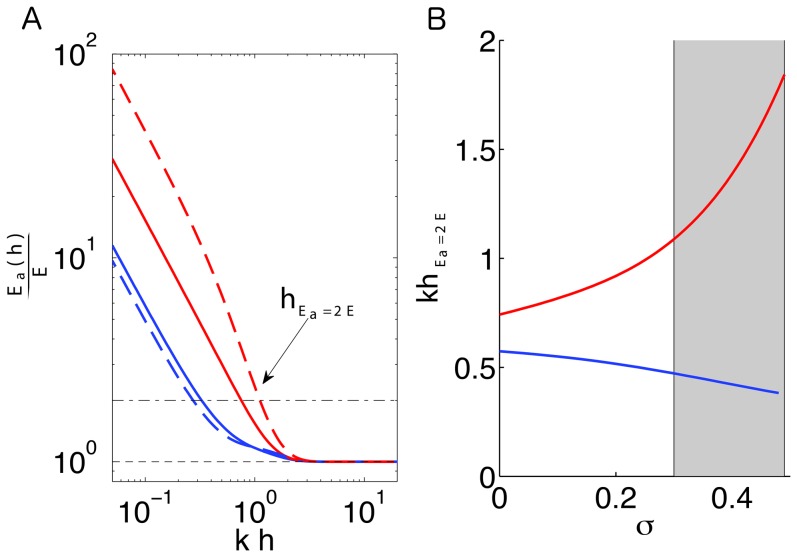
 as a function of the substratum thickness h normalized with the inverse wavenumber
  of the strain/stress fields. For simplicity, the
  case is represented but similar results are obtained for other combinations of the wavenumbers.–––, normal direction and
  ;––––, tangential direction and
  ;– – –, normal direction and
  ;– – –, tangential direction and
  . The black horizontal lines indicate the levels
  (no increase in apparent elastic modulus,– – –) and
  (two-fold increase,–– – ––). Panel (
b
) displays the sensing depth defined as the value of h that yields a two-fold increase in apparent elastic modulus compared to
(two-fold increase,–– – ––). Panel (
b
) displays the sensing depth defined as the value of h that yields a two-fold increase in apparent elastic modulus compared to  . The sensing depth is represented as a function of the Poisson's ratio for tangential and normal traction stresses.–––, normal direction;–––, tangential direction. The shaded patch represents the range of values of Poisson's ratio measured for polymer networks –.
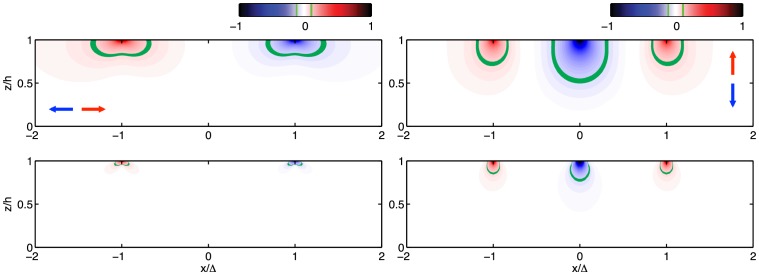
 and
and  ), and solving the elastostatic equation for different values of z. The deformation is plotted in the normal plane
  as a function of
  and
and  . Thus,
  represents the bottom of the gel in contact with the coverslip and
  represents the free surface of the gel. (b) Same as (a) for the normal deformation w obtained by applying a unit normal deformation at the gel surface (eqs. 11–13 with
  and
and  ). (c) Same as (a) for
  . (d) Same as (b) for
  . In all panels, the data are normalized between −1 and 1, and the green contour represents the 10% iso-level.
Similar articles
-
Two-Layer Elastographic 3-D Traction Force Microscopy.Sci Rep. 2017 Jan 11;7:39315. doi: 10.1038/srep39315. Sci Rep. 2017. PMID: 28074837 Free PMC article.
-
Finite element analysis of traction force microscopy: influence of cell mechanics, adhesion, and morphology.J Biomech Eng. 2013 Jul 1;135(7):71009. doi: 10.1115/1.4024467. J Biomech Eng. 2013. PMID: 23720059 Free PMC article.
-
2.5D Traction Force Microscopy: Imaging three-dimensional cell forces at interfaces and biological applications.Int J Biochem Cell Biol. 2023 Aug;161:106432. doi: 10.1016/j.biocel.2023.106432. Epub 2023 Jun 7. Int J Biochem Cell Biol. 2023. PMID: 37290687 Review.
-
High resolution, large deformation 3D traction force microscopy.PLoS One. 2014 Apr 16;9(4):e90976. doi: 10.1371/journal.pone.0090976. eCollection 2014. PLoS One. 2014. PMID: 24740435 Free PMC article.
-
Quantifying traction stresses in adherent cells.Methods Cell Biol. 2012;110:139-78. doi: 10.1016/B978-0-12-388403-9.00006-0. Methods Cell Biol. 2012. PMID: 22482948 Review.
Cited by
-
Three-dimensional balance of cortical tension and axial contractility enables fast amoeboid migration.Biophys J. 2015 Feb 17;108(4):821-832. doi: 10.1016/j.bpj.2014.11.3478. Biophys J. 2015. PMID: 25692587 Free PMC article.
-
Cytoskeletal Mechanics Regulating Amoeboid Cell Locomotion.Appl Mech Rev. 2014 Jun 5;66(5):0508041-05080414. doi: 10.1115/1.4026249. Appl Mech Rev. 2014. PMID: 25328163 Free PMC article.
-
Visualizing the Invisible: Advanced Optical Microscopy as a Tool to Measure Biomechanical Forces.Front Cell Dev Biol. 2021 Sep 6;9:706126. doi: 10.3389/fcell.2021.706126. eCollection 2021. Front Cell Dev Biol. 2021. PMID: 34552926 Free PMC article. Review.
-
Measuring cell-generated forces: a guide to the available tools.Nat Methods. 2016 Apr 28;13(5):415-23. doi: 10.1038/nmeth.3834. Nat Methods. 2016. PMID: 27123817 Free PMC article. Review.
-
In situ mechanotransduction via vinculin regulates stem cell differentiation.Stem Cells. 2013 Nov;31(11):2467-77. doi: 10.1002/stem.1490. Stem Cells. 2013. PMID: 23897765 Free PMC article.
References
-
- Li S, Guan J, Chien S (2005) Biochemistry and biomechanics of cell motility. ANNUAL REVIEW OF BIOMEDICAL ENGINEERING 7: 105–150. - PubMed
-
- Engler AJ, Sen S, Sweeney HL, Discher DE (2006) Matrix elasticity directs stem cell lineage specification. Cell 126: 677–689. - PubMed
-
- Discher D, Janmey P, Wang Y (2005) Tissue cells feel and respond to the stiffness of their substrate. Science 310: 1139. - PubMed
Publication types
MeSH terms
Grants and funding
LinkOut - more resources
Full Text Sources
Other Literature Sources
