. 2013 Nov;24(21):3369-80.
doi: 10.1091/mbc.E13-07-0405. Epub 2013 Sep 4.

Mammalian target of rapamycin and Rictor control neutrophil chemotaxis by regulating Rac/Cdc42 activity and the actin cytoskeleton

Affiliations

Mammalian target of rapamycin and Rictor control neutrophil chemotaxis by regulating Rac/Cdc42 activity and the actin cytoskeleton

Yuan He et al. Mol Biol Cell. 2013 Nov.

Abstract

Chemotaxis allows neutrophils to seek out sites of infection and inflammation. The asymmetric accumulation of filamentous actin (F-actin) at the leading edge provides the driving force for protrusion and is essential for the development and maintenance of neutrophil polarity. The mechanism that governs actin cytoskeleton dynamics and assembly in neutrophils has been extensively explored and is still not fully understood. By using neutrophil-like HL-60 cells, we describe a pivotal role for Rictor, a component of mammalian target of rapamycin complex 2 (mTORC2), in regulating assembly of the actin cytoskeleton during neutrophil chemotaxis. Depletion of mTOR and Rictor, but not Raptor, impairs actin polymerization, leading-edge establishment, and directional migration in neutrophils stimulated with chemoattractants. Of interest, depletion of mSin1, an integral component of mTORC2, causes no detectable defects in neutrophil polarity and chemotaxis. In addition, experiments with chemical inhibition and kinase-dead mutants indicate that mTOR kinase activity and AKT phosphorylation are dispensable for chemotaxis. Instead, our results suggest that the small Rho GTPases Rac and Cdc42 serve as downstream effectors of Rictor to regulate actin assembly and organization in neutrophils. Together our findings reveal an mTORC2- and mTOR kinase-independent function and mechanism of Rictor in the regulation of neutrophil chemotaxis.


Figures
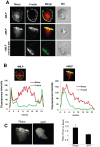
FIGURE 1:
FIGURE 1:
Rictor is recruited to the leading edge of polarized dHL-60 cells. (A) Immuno­fluorescence of Rictor (red) and F-actin (green) in cells plated on fibrinogen without (top) or with (middle) fMLP stimulation (100 nM, 2 min). Fluorescence images of Rictor (red), F-actin (green), Rictor/F-actin merged images, and differential interference contrast (DIC) images of cells. The Rictor immunofluorescence is specific because incubation with the Rictor peptide completely abolishes the immunofluorescence (bottom). Bar, 10 μm. (B) Fluorescence line profiles of Rictor (Red) and F-actin (green) in dHL-60 cells with or without fMLP stimulation. The graph below the fluorescence image plots the fluorescence intensity of each probe (y-axis) vs. distance (x-axis) for the corresponding cell. (C) Ratios of mean fluorescence intensity of Rictor and GFP between the front and the back of cells. Left, representative Rictor and GFP images; right, quantification of 41 cells (for Rictor) and 38 cells (for GFP) collected from four independent experiments. The front of the cell is defined as the area within the first 3 μm of the cell (indicated by the yellow line), as depicted earlier (Shin et al., 2010), and the rest of the cell is defined as the back. Student's t test was performed. The asterisk indicates that the ratio for Rictor differs statistically from that of GFP (*p < 0.01).
FIGURE 2:
FIGURE 2:
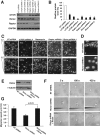
Rictor depletion impairs dHL-60 chemotaxis. (A) Western blotting of mTOR, Raptor, and Rictor in dHL-60 cells transfected with specific or NT shRNAs. GAPDH was a loading control. HL-60 cells were infected with lentiviruses containing the various shRNAs and were differentiated for 5 d in the presence of DMSO. (B) Relative levels of mTOR, Raptor, and Rictor in cells with or without depletion. Values are normalized to the level in control cells (with the NT shRNA, 100%) and are means ± SEM (n = 4). (C) Chemotaxis of dHL-60 cells with various treatments in a microfluidic gradient device. After adhering to the fibrinogen-coated surface of the microfluidic chamber, cells (2 × 10⁶) were exposed to an fMLP gradient for 20 min. Phase-contrast images of cells 10 and 910 s after fMLP stimulation. Bar, 50 μm. Supplemental Movies S1–S3 are of cells with or without mTOR and Rictor depletion. (D) Images with higher magnification of cells with NT (I) and Rictor shRNA (II) treatment, 910 s after exposure to fMLP gradients. Bar, 10 μm. (E) Western blotting of Rictor in control and Rictor-depleted dHL-60 cells with or without rescue. Rictor-depleted cells were differentiated and transfected with wild-type (WT) Rictor. α-Tubulin was a loading control. (F) Wild-type Rictor rescues the migratory defects of Rictor-depleted cells revealed with the micropipette assay. Time-lapse images of representative cells for various conditions. The three images in each column show the positions of individual cells (identified with a superimposed letter) after exposure to fMLP. Bar, 10 μm. (G) Speeds of cell migration for control, Rictor-depleted, and rescued cells revealed with the micropipette assay. Values are means ± SEM (n = 21 for control, 16 for Rictor shRNA alone, and 15 for Rictor shRNA plus wild-type Rictor). The cells with Rictor rescue differ statistically from the Rictor-depleted cells (p < 0.01).
FIGURE 3:
FIGURE 3:
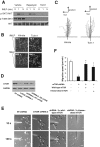
mTOR kinase activity is dispensable for chemotaxis. (A) Western blotting of AKT (p-S473) and S6K1 (p-T389) phosphorylation in cells pretreated with vehicle (DMSO), rapamycin (100 nM), or Torin1 (250 nM) for 30 min and stimulated with fMLP (100 nM) for indicated time points. AKT is the loading control. (B) Chemotaxis of dHL-60 cells with or without Torin1 treatment (250 nM, 30 min) in a microfluidic gradient device. Phase-contrast images of cells 10 and 480 s after fMLP stimulation. Bar, 50 μm. (C) Trajectory of dHL-60 cells migrating in the microfluidic chamber. Cell migration was recorded using time-lapse microscope, and the migration path of individual cells was analyzed and plotted using ImageJ (National Institutes of Health, Bethesda, MD). (D) Western blotting of mTOR in control and mTOR-depleted dHL-60 cells with or without rescue. mTOR-depleted cells were differentiated and transfected with WT mTOR or a kinase-dead mutant of mTOR. mTOR was depleted with shRNA-3, which targets the 3′-UTR of mTOR and thus exerts no effect on ectopically expressed mTOR. GAPDH is the loading control. (E) Both wild-type mTOR and the kinase-dead mTOR mutant rescue the migratory defects of mTOR-depleted cells revealed with the micropipette assay. Time-lapse images of representative cells for various conditions. The two images in each column show the positions of individual cells (identified with a superimposed letter) after exposure to fMLP. Bar, 10 μm. (F) Speeds of cell migration for control, mTOR-depleted, and rescued cells revealed with the micropipette assay. Values are means ± SEM (n = 18 for control, 19 for mTOR shRNA alone, 17 for mTOR shRNA plus wild-type mTOR, and 15 for mTOR shRNA plus mTOR kinase-dead mutant). Asterisks indicate that the cells differ statistically from the mTOR-depleted cells (*p < 0.001).
FIGURE 4:
FIGURE 4:
Rictor depletion impairs actin polymerization in dHL-60 cells. (A) Quantification of F-actin levels in suspended cells. Cells with or without Rictor depletion were stimulated with fMLP (100 nM) for various times in suspension and fixed for staining with fluorescently labeled phalloidin. Fluorescence in stained cells was determined by flow cytometry. Values are mean ± SEM (n = 4). (B) F-actin staining of dHL-60 cells with or without Rictor or mTOR depletion after fMLP stimulation. Cells were plated on fibrinogen-coated coverslips for 20 min and stimulated with uniform fMLP (100 nM) for 2 min. Images of F-actin and DIC. Bar, 10 μm. (C) Quantification of the number of dHL-60 cells with polarized actin polymerization with and without Rictor depletion. Cells were stimulated with uniform fMLP (100 nM) for 2 min, as described in B. Each bar represents the mean ± SEM (n = 4). (D) The dynamics of actin-YFP in dHL-60 cells exposed to an fMLP gradient. HL-60 cells stably expressing actin-YFP were infected with lentivirus containing NT shRNA or Rictor shRNA (shRNA-1) and subsequently differentiated for 5 d. Cells were plated on fibrinogen-coated coverslips and stimulated with a chemotactic gradient delivered by a micropipette containing 10 μM fMLP for the times indicated. Fluorescence images of actin-YFP and the corresponding DIC images. Bar, 10 μm.
FIGURE 5:
FIGURE 5:
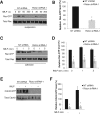
Rictor depletion impairs Rac and Cdc42 activities in dHL-60 cells. (A) The levels of Rac-GTP in suspended dHL-60 cells. dHL-60 cells with or without Rictor depletion were stimulated with 100 nM of fMLP for various time points in suspension and lysed for the pull-down assay. Levels of total Rac were used to show cell lysate input. (B) Quantification of relative levels of Rac-GTP level in suspended dHL-60 cells with and without Rictor depletion 30 s after fMLP stimulation. Each bar represents the mean ± SEM (error bars). Values are normalized to the level of Rac-GTP (= 100%) in cells without Rictor depletion (*p < 0.001). (C) The levels of Rac-GTP in adherent dHL-60 cells. Control cells or Rictor-depleted cells plated on fibrinogen-coated plates were unstimulated or stimulated for 1 or 5 min with a uniform concentration of fMLP (100 nM) and lysed for pull-down assay. Levels of total Rac were used to show cell lysate input. (D) Quantification of relative levels of Rac-GTP in adherent dHL-60 cells with and without Rictor depletion. Each bar represents the mean ± SEM (n = 4). Values are normalized to the level of Rac-GTP (= 100%) in cells without Rictor depletion before fMLP stimulation (*p < 0.001). (E) The levels of Cdc42-GTP in dHL-60 cells with or without Rictor depletion. dHL-60 cells with or without Rictor depletion were stimulated with 100 nM of fMLP for 30 s in suspension and lysed for the pull-down assay. Levels of total Cdc42 were used to show cell lysate input. (F) Quantification of relative levels of Cdc42-GTP in suspended dHL-60 cells with and without Rictor depletion. Each bar represents the mean ± SEM (n = 4). Values are normalized to the level of Cdc42-GTP (= 100%) in cells without Rictor depletion before fMLP stimulation (*p < 0.001).
FIGURE 6:
FIGURE 6:
Actin polymers are not responsible for Rictor regulation of Rac activity. (A) Quantification of F-actin levels in suspended cells. Cells with or without pretreatment of latrunculin B (10 μg/ml, 10 min) were stimulated with fMLP (100 nM) for various times in suspension and fixed for staining with fluorescently labeled phalloidin. (B) The levels of Rac-GTP in suspended dHL-60 cells with or without latrunculin B pretreatment (10 min; 10 μg/ml, top; 20 μg/ml, bottom) were stimulated with 100 nM of fMLP (30 s) and lysed for the pull-down assay. Levels of total Rac were used to show cell lysate input. (C) Quantification of relative levels of Rac-GTP level in suspended dHL-60 cells with or without latrunculin B pretreatment 30 s after fMLP stimulation. Each bar represents the mean ± SEM (error bars). Values are normalized to the level of Rac-GTP (= 100%) in cells without latrunculin B pretreatment (*p < 0.001). (D) The fluorescence image of Rictor (green), F-actin (red), and merged Rictor and F-actin image and DIC image of dHL-60 cells pretreated or not pretreated with latrunculin B (10 μg/ml, 10 min) and stimulated with a uniform concentration of fMLP (100 nM, 1 min). The white arrows point to the areas with Rictor cortical localization. Bar, 10 μm.

Similar articles

Cited by

References

    1. Agarwal NK, Chen CH, Cho H, Boulbes DR, Spooner E, Sarbassov DD. Rictor regulates cell migration by suppressing RhoGDI2. Oncogene. 2013;32:2521–2526. - PMC - PubMed
    1. Alessi DR, James SR, Downes CP, Holmes AB, Gaffney PR, Reese CB, Cohen P. Characterization of a 3-phosphoinositide-dependent protein kinase which phosphorylates and activates protein kinase Balpha. Curr Biol. 1997;7:261–269. - PubMed
    1. Andrew N, Insall RH. Chemotaxis in shallow gradients is mediated independently of PtdIns 3-kinase by biased choices between random protrusions. Nat Cell Biol. 2007;9:193–200. - PubMed
    1. Barnett SF, et al. Identification and characterization of pleckstrin-homology-domain-dependent and isoenzyme-specific Akt inhibitors. Biochem J. 2005;385:399–408. - PMC - PubMed
    1. Bayle JH, Grimley JS, Stankunas K, Gestwicki JE, Wandless TJ, Crabtree GR. Rapamycin analogs with differential binding specificity permit orthogonal control of protein activity. Chem Biol. 2006;13:99–107. - PubMed

Publication types

MeSH terms

Substances

LinkOut - more resources