. 2013 Oct 1;191(7):3681-93.
doi: 10.4049/jimmunol.1201954. Epub 2013 Aug 30.

ICAM-1-dependent homotypic aggregates regulate CD8 T cell effector function and differentiation during T cell activation

Affiliations

ICAM-1-dependent homotypic aggregates regulate CD8 T cell effector function and differentiation during T cell activation

Nicholas A Zumwalde et al. J Immunol. .

Abstract

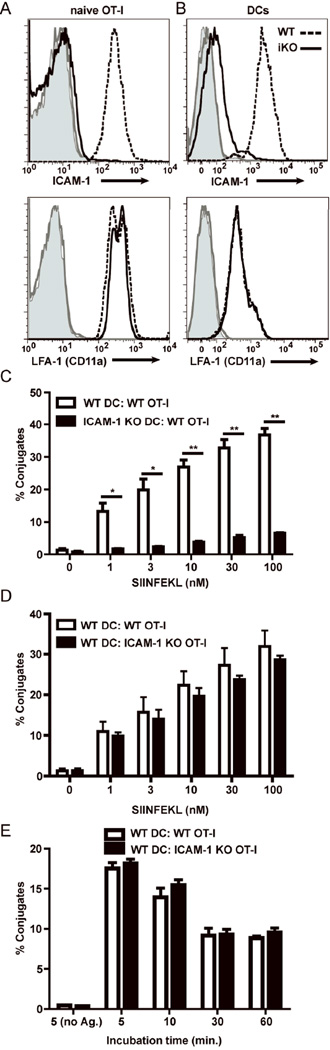
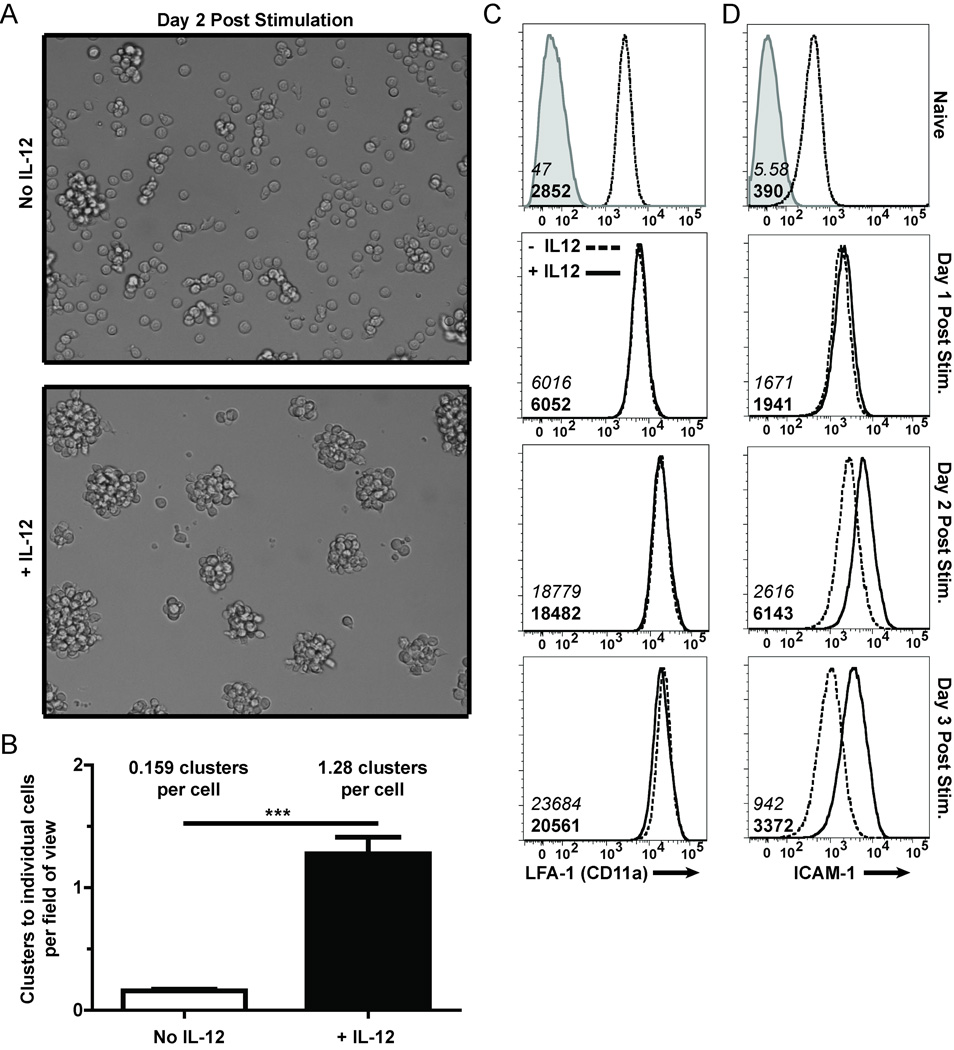
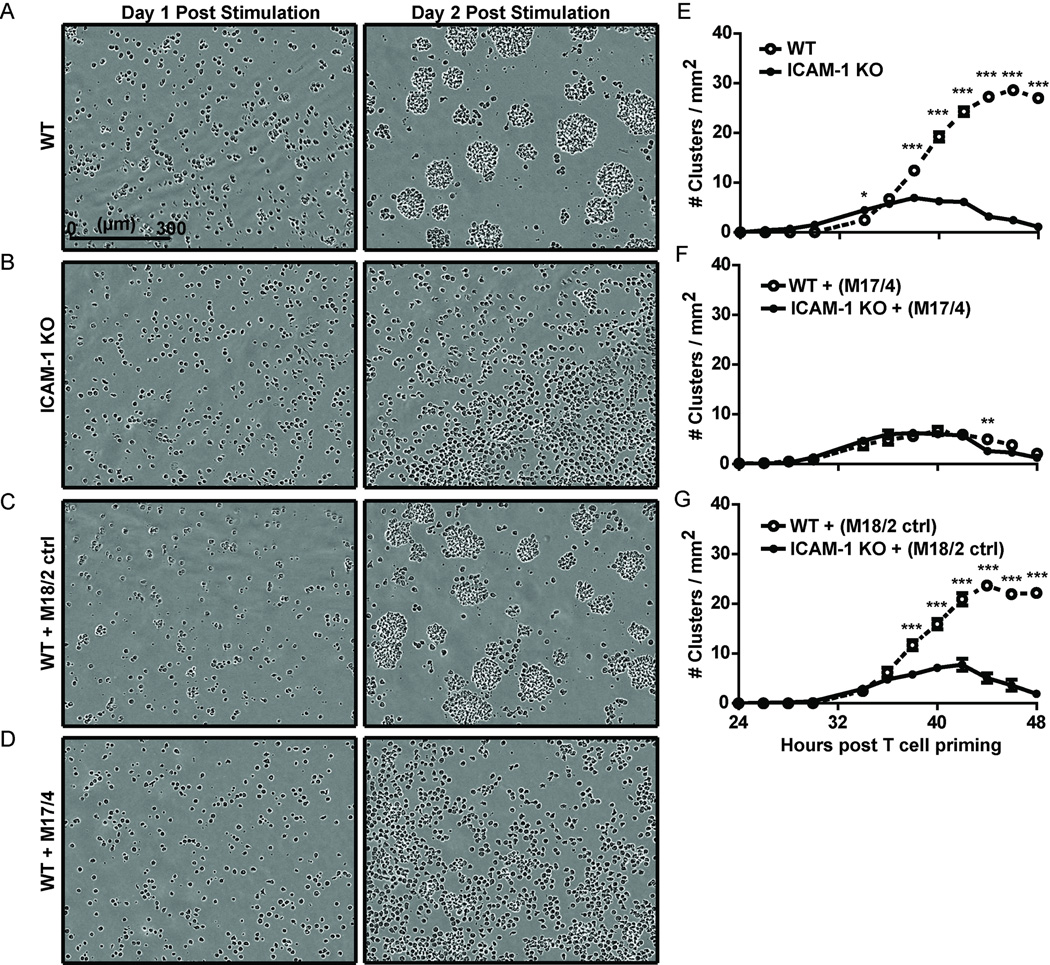
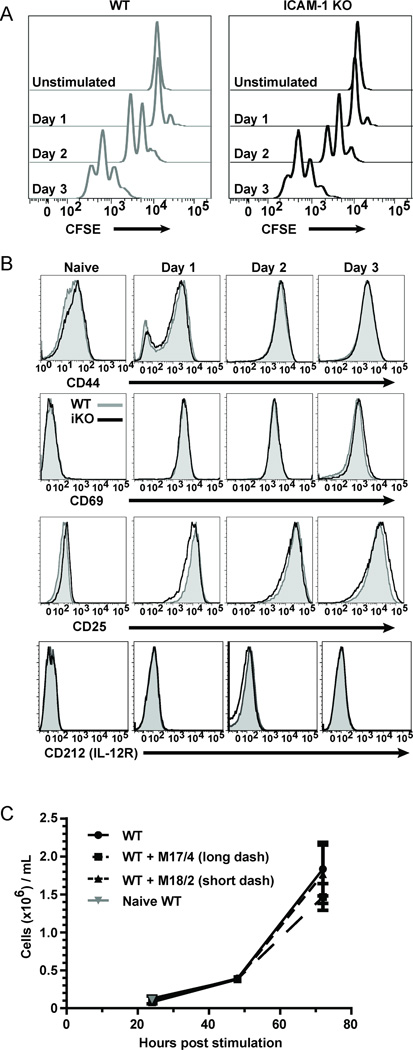
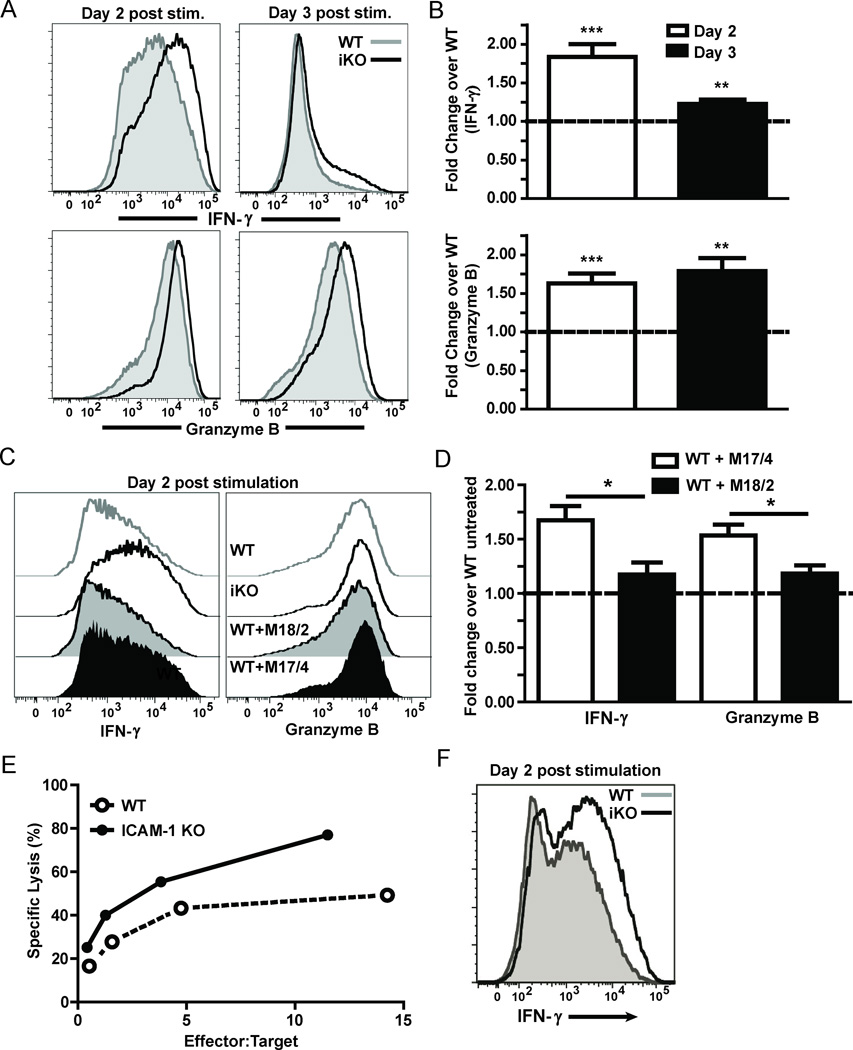
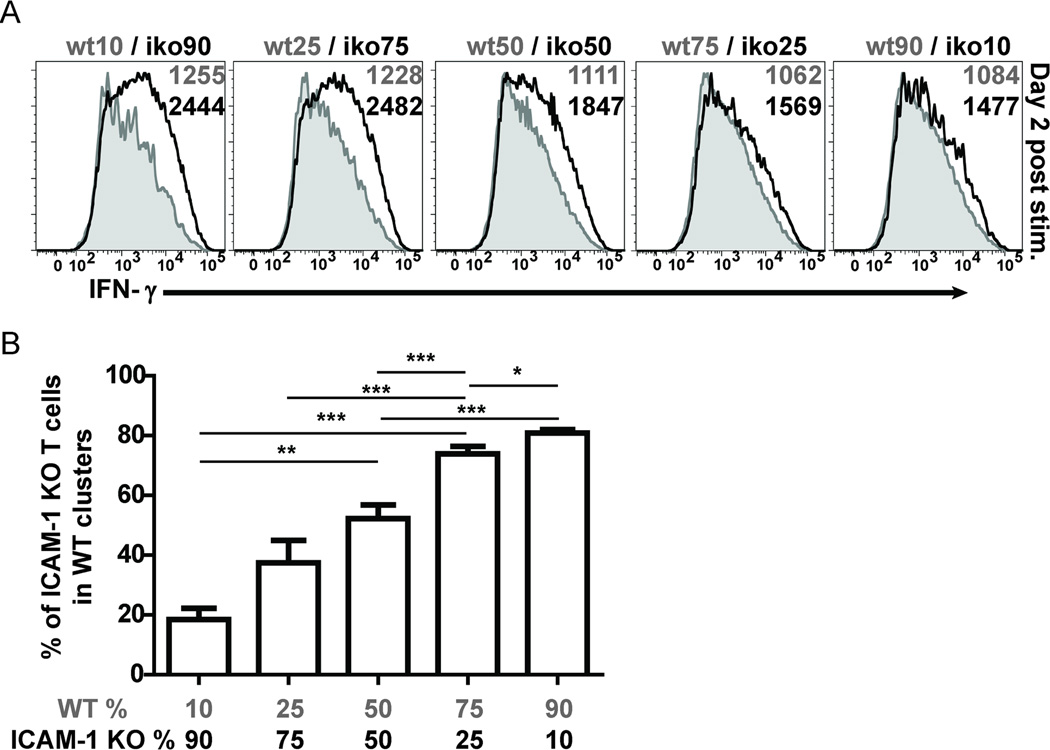
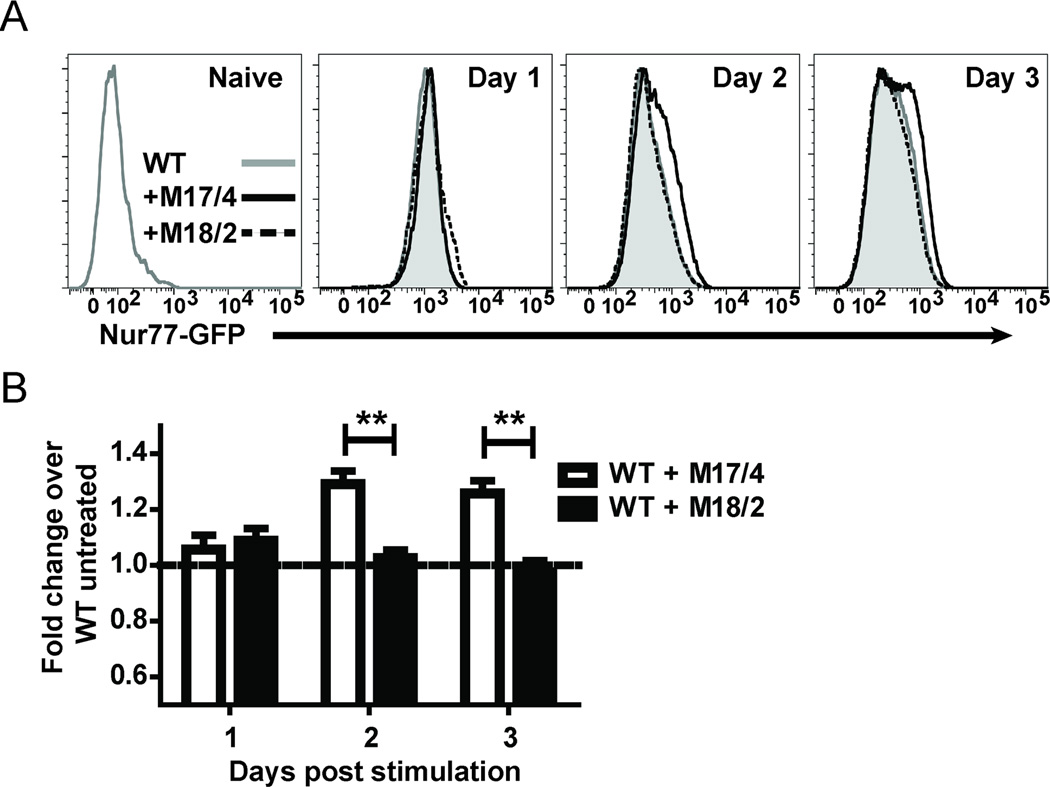
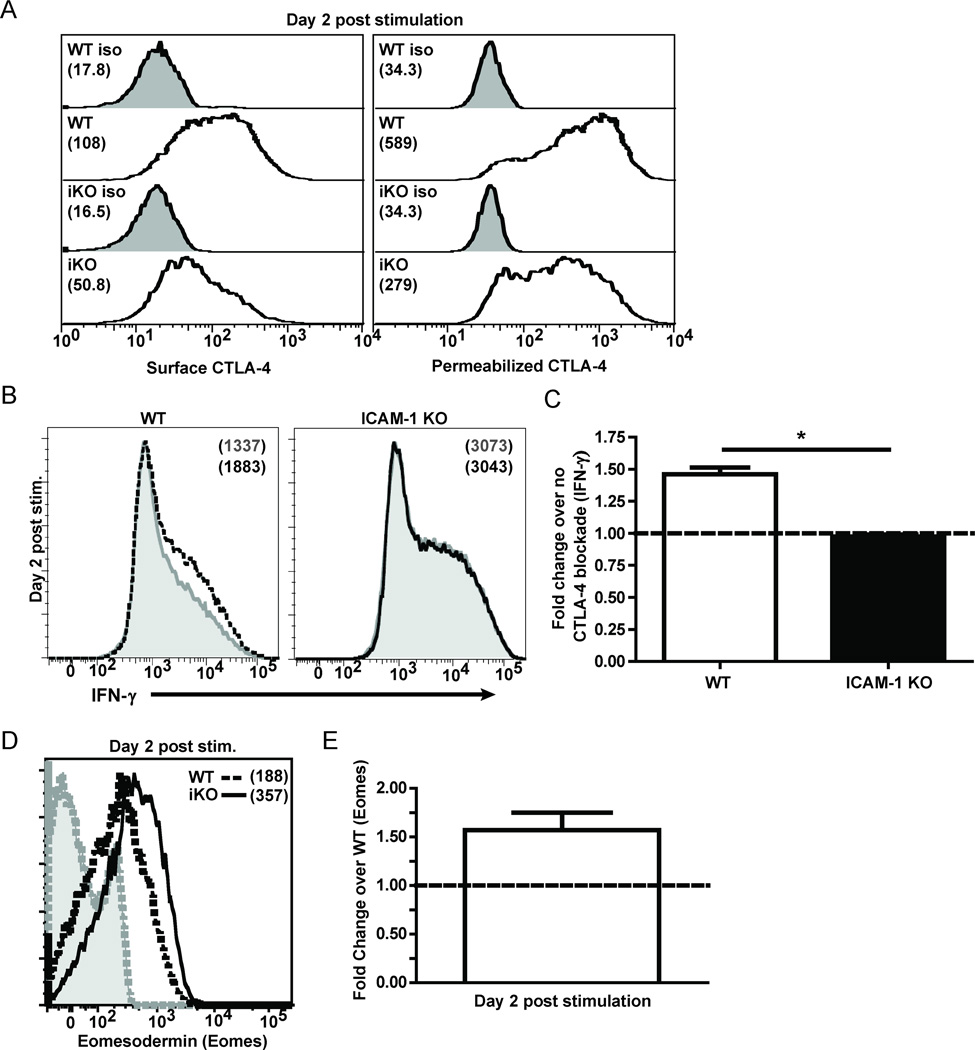
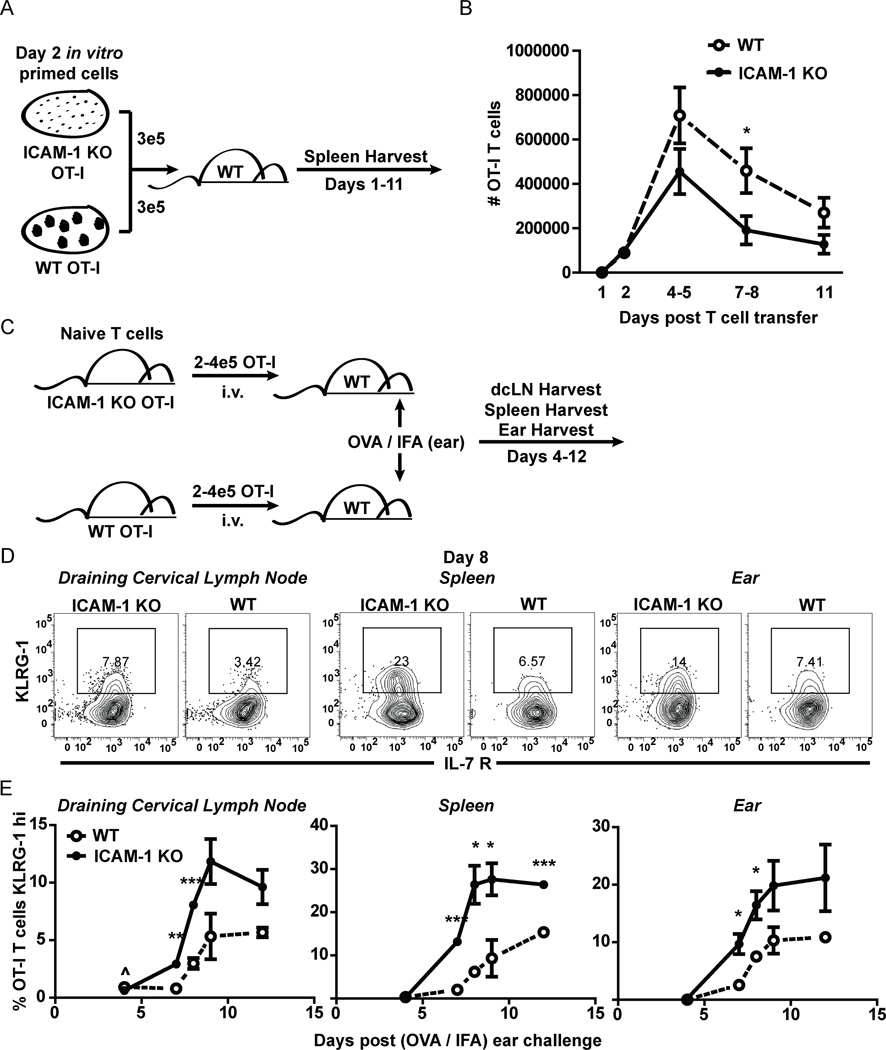
A hallmark of T cell activation in vitro and in vivo is the clustering of T cells with each other via interaction of the LFA-1 integrin with ICAM-1. The functional significance of these homotypic aggregates in regulating T cell function remains unknown. We used an APC-free in vitro activation system to demonstrate that stimulation of purified naive CD8 T cells results in enhanced expression of ICAM-1 on T cells that is sustained by the inflammatory cytokine IL-12 and associated with robust T cell aggregates. ICAM-1-deficient CD8 T cells proliferate normally but demonstrate a striking failure to aggregate. Interestingly, loss of ICAM-1 expression results in elevated levels of IFN-γ and granzyme B, as well as enhanced cytotoxicity. Similar results were obtained when anti-LFA-1 Ab was used to block the clustering of wild-type T cells. ICAM-1 ligation is not required for IFN-γ regulation, as clustering of ICAM-1-deficient CD8 T cells with wild-type T cells reduces IFN-γ expression. Analysis using a fluorescent reporter that monitors TCR signal strength indicates that T cell clustering limits T cell exposure to Ag during activation. Furthermore, T cell clustering promotes the upregulation of the CTLA-4 inhibitory receptor and the downregulation of eomesodermin, which controls effector molecule expression. Activation of ICAM-1-deficient CD8 T cells in vivo results in an enhanced percentage of KLRG-1(+) T cells indicative of short-lived effectors. These results suggest that T cell clustering represents a mechanism that allows continued proliferation but regulates T cell effector function and differentiation.


Figures

Figure 1
Figure 1. ICAM-1 is dispensable on T cells for mediating stable interactions with DCs
(A) Expression of ICAM-1 and LFA-1 α-subunit (CD11a) on naïve wild-type (wt) (dashed histograms) and ICAM-1 deficient (iKO) (solid black histograms) OT-I T cells, and (B) C57BL/6 wt (dashed histograms) and iKO (solid black histograms) CD11c+I-Ab+ DCs. Isotype control staining is shown in shaded histograms. (C) Conjugate efficiency assessed between wt OT-I T cells and CD11c+ wt DCs (open bars) or CD11c+ iKO DCs (solid bars) pulsed with the indicated amounts of SIINFEKL peptide and incubated together for 10 minutes. Data are pooled from two independent experiments. * p < 0.05, ** p < 0.01. (D) Conjugate efficiency assessed between wt (open bars) or iKO (solid bars) OT-I T cells and incubated for 10 minutes with wt DCs pulsed with the indicated amounts of SIINFEKL peptide. Data are pooled from three independent experiments. (E) Conjugate efficiency assessed between wt (open bars) or iKO (solid bars) OT-I T cells and incubated for 5–60 minutes with wt DCs pre-pulsed with 30 nM SIINFEKL.
Figure 2
Figure 2. IL-12 induces T cell clustering, but has differential effects on the expression of LFA-1 and ICAM-1
(A) Images of highly purified wild-type (wt) OT-I T cells after two days of activation with immobilized Ag and B7-1 in the absence (upper image) or presence (lower image) of IL-12. (B) Quantification of ratios of clusters to individual T cells in the absence or presence of IL-12. *** p = 0.0008. (C) Kinetics of LFA-1 α-subunit (CD11a) (D) and ICAM-1 expression on purified wt naïve and activated OT-I T cells. Expression of LFA-1 and ICAM-1 on T cells activated in the presence or absence of IL-12 is shown at each time point. Shaded histograms represent isotype control staining. gMFI values for expression in the absence of IL-12 (italics) or in the presence of IL-12 (black) are shown in each panel. Data are representative of one experiment from at least three independent experiments.
Figure 3
Figure 3. ICAM-1 deficiency and anti-LFA-1 integrin blockade inhibit the formation of T cell activation clusters
(A–D) Images taken using an IncuCyte™ ZOOM live imager of highly purified wild-type (wt), ICAM-1 deficient (iKO), wt + M18/2 anti-LFA-1 antibody, and wt + M17/4 anti-LFA-1 antibody OT-I T cells after one and two days of activation with Ag, B7-1 and IL-12. Scale bar (0–300 µm) present in lower left corner of (A). (E–G) Quantification of time course images taken in (A) every two hours was performed as described in Materials and Methods. The number of clusters per mm2 is shown for n=8–16 total movies. * p < 0.05; ** p < 0.01; *** p ≤ 0.0002.
Figure 4
Figure 4. ICAM-1 deficiency does not alter in vitro activation of CD8 T cells or expression of activation markers
(A) CFSE dye dilution of wild-type (wt) (gray) and ICAM-1 deficient (iKO) (black) OT-I T cells that were unstimulated or stimulated for 1–3 days with Ag, B7-1 and IL-12. (B) Expression of CD44, CD69, CD25 and IL-12 receptor (CD212) on wt OT-I T cells (shaded histograms) and iKO OT-I T cells (black histograms) after stimulation with Ag, B7-1 and IL-12. (C) Recovery of wt OT-I T cell (solid line) and wt OT-I T cell + anti-LFA-1 antibody treatments (M17/4 – long dashes, M18/2 – short dashes) after in vitro activation with Ag, B7-1 and IL-12. Data are pooled from at least three independent experiments.
Figure 5
Figure 5. ICAM-1-deficient T cells have enhanced effector function after stimulation
(A) Expression of IFN-γ and Granzyme B in wild-type (wt) (shaded histograms) and ICAM-1-deficient (iKO) (black histograms) OT-I T cells two and three days post stimulation with Ag, B7-1 and IL-12. (B) IFN-γ and Granzyme B expression (median fluorescence intensity values) by activated iKO OT-I T cells normalized to expression by wt OT-I T cells at days 2 (n≥15 independent experiments) and 3 (n≥6 independent experiments) post stimulation. ** p value≤0.008, *** p value≤0.0002. (C) wt OT-I T cells, iKO OT-I T cells, and wt OT-I T cells treated with the anti-LFA-1 integrin antibodies M18/2 or M17/4 were activated with Ag, B7-1 and IL-12. IFN-γ and Granzyme B expression was assessed by flow cytometry two days after stimulation. (D) Fold change in IFN-γ and Granzyme B expression (median fluorescence intensities) as shown in (C) using wt OT-I T cells activated in the presence of the M17/4 or M18/2 antibodies normalized to the expression by untreated activated wt OT-I T cells (n=4 independent experiments). * p < 0.05. (E) Cytolytic activity of day three activated wt and iKO OT-I T cells determined using a standard 51Cr-release assay with EG.7 OVA target cells. Results shown are one experiment representative of greater than three independent experiments. (F) IFN-γ expression by wt and iKO OT-I T cells two days post stimulation with non transgenic wt splenocytes and SIINFEKL peptide. Data is from one of three independent experiments.
Figure 6
Figure 6. ICAM-1 deficient T cells co-clustered with wild-type T cells leads to reduced IFN-γ production
IFN-γ expression was assessed in wild-type (wt) (shaded histogram) and ICAM-1 deficient (iKO) (black histogram) OT-I T cells activated for two days with Ag, B7-1 and IL-12. The ratio of wt OT-I T cells to iKO OT-I T cells varied from 10% of the starting population (left panel) to 90% of the starting population (right panel). The starting number of T cells in each well was maintained at 5×10⁴ cells/well. Wild-type and iKO OT-I T cells in the same culture were identified by flow cytometry using congenic markers. Median fluorescence intensities for wt (gray) and iKO (black) T cells are shown in the upper right hand corner of each plot. Data are from one experiment that is representative of three independent experiments. (B) Quantification of the percentage of CellTrace™ Violet labeled iKO T cells in contact with wt T cell clusters. Images from at least two independent experiments (n=3–10 images) were used. * p < 0.05, ** p < 0.01, *** p <0.0002.
Figure 7
Figure 7. Increased Ag sensing by unclustered T cells
(A) Kinetics of GFP expression in wild-type (wt) GFP-Nur77 OT-I T cells activated for 1–3 days with Ag, B7-1 and IL-12 in the absence (shaded histograms) or presence of the anti-LFA-1 antibodies M17/4 (black histograms) or M18/2 (dotted histograms). Expression of GFP in unstimulated naïve GFP-Nur77 OT-I T cells is shown in the far left panel. (B) Fold change in GFP expression in wt OT-I T cells activated in the presence of anti-LFA-1 antibodies M17/4 (open bars) or M18/2 (solid bars) normalized to expression in untreated activated wt OT-I T cells. Graph shows data pooled from three independent experiments. ** p < 0.01.
Figure 8
Figure 8. T cell activation clusters regulate CTLA-4 and eomesodermin expression
(A) Wild-type (wt) and ICAM-1 deficient (iKO) OT-I T cells were activated with Ag, B7-1 and IL-12 for two days and assessed for surface (left panel) and intracellular/permeabilized CTLA-4 (right panel) expression. Median fluorescence intensity values for each plot are shown in parentheses. Isotype (iso) staining is shown in gray and CTLA-4 staining in black. Data shown are from one experiment representative of at least three independent experiments. (B) Wild-type and iKO OT-I T cells were stimulated as above but in the presence of 30 µg/ml anti-CTLA-4 blocking antibody and assessed for IFN-γ production. Untreated samples are shown with gray histograms and anti-CTLA-4 treated samples are depicted with black lines. Median fluorescence intensities are shown in the upper right corner. (C) Quantification of fold changes in IFN-γ expression by the anti-CTLA-4 treated samples normalized to the untreated samples as shown in (B). Data are from at least two independent experiments pooled together. * p < 0.05. (D) Wild-type (dashed line) and iKO (solid line) OT-I T cells were stimulated with Ag, B7-1 and IL-12 for two days and assessed for intracellular eomesodermin (Eomes) transcription factor expression. Isotypes are shown in gray dashed (wt) and gray shaded (iKO) histograms. Geometric mean fluorescence intensities are shown in parentheses in the upper right corner. (E) Quantification of fold change in Eomes expression in the iKO OT-I T cells when normalized to wt expression for three independent experiments. p = 0.0864.
Figure 9
Figure 9. ICAM-1 deficient T cells show signs of impaired expansion and increased differentiation in vivo
(A) Schematic model of experimental setup of co-adoptively transferred activated T cells. Specifically, 3×10⁵ wild-type (wt) and 3×10⁵ ICAM-1 deficient (iKO) OT-I T cells activated in vitro for two days with Ag, B7-1 and IL-12 were co-adoptively transferred into wt non transgenic naïve recipients. Naïve recipient mice were sacrificed at indicated time points and spleens harvested for OT-I T cell quantification. (B) T cell curve showing Ag-independent expansion and contraction of wt (dashed line) and iKO (solid line) OT-I T cells between 1 and 11 days post co-adoptive transfer. Data are pooled from at least four experiments. Day 1 (n≥2), day 2 (n=10), days 4–5 (n=11), days 7–8 (n=7), day 11 (n=5). * p < 0.05. (C) Schematic model of experimental setup of adoptive transfer of naïve OT-I T cells with subsequent in vivo activation. Briefly, 2–4×10⁵ naïve wt or iKO OT-I T cells were intravenously transferred into separate naïve C57BL/6 recipients. One day later, mice were anesthetized and injected with 3 µg OVA protein emulsified in Incomplete Freund’s Adjuvant (IFA) into the ear pinna. Mice were sacrificed and tissues harvested approximately 4–12 days post OVA/IFA challenge. (D) Representative examples of KLRG-1 and IL-7 receptor staining for iKO and WT OT-I T cells harvested from the draining cervical lymph node, spleen and ear at day 8 post challenge. (E) Quantification of KLRG-1+ wt (dashed line) and iKO (solid line) OT-I T cells from days 4–12 post ear challenge in the draining cervical lymph node, spleen and ear. * p < 0.05, ** p <0.01, *** p ≤ 0.0008, ^ p < 0.05 (for wt). These data are from one experiment (n=3 mice for each time point) that is representative of at least four independent experiments.

Similar articles

Cited by

References

    1. Curtsinger JM, Mescher MF. Inflammatory cytokines as a third signal for T cell activation. Curr. Opin. Immunol. 2010;22:333–340. - PMC - PubMed
    1. Xiao Z, Casey KA, Jameson SC, Curtsinger JM, Mescher MF. Programming for CD8 T cell memory development requires IL-12 or type I IFN. J. Immunol. 2009;182:2786–2794. - PMC - PubMed
    1. Mescher MF, Curtsinger JM, Agarwal P, Casey KA, Gerner M, Hammerbeck CD, Popescu F, Xiao Z. Signals required for programming effector and memory development by CD8+ T cells. Immunol. Rev. 2006;211:81–92. - PubMed
    1. Agarwal P, Raghavan A, Nandiwada SL, Curtsinger JM, Bohjanen PR, Mueller DL, Mescher MF. Gene regulation and chromatin remodeling by IL-12 and type I IFN in programming for CD8 T cell effector function and memory. J. Immunol. 2009;183:1695–1704. - PMC - PubMed
    1. Curtsinger JM, Valenzuela JO, Agarwal P, Lins D, Mescher MF. Type I IFNs provide a third signal to CD8 T cells to stimulate clonal expansion and differentiation. J. Immunol. 2005;174:4465–4469. - PubMed

Publication types

MeSH terms