. 2013 Dec;23(12):2053-65.
doi: 10.1101/gr.155028.113. Epub 2013 Aug 29.

H4K16 acetylation marks active genes and enhancers of embryonic stem cells, but does not alter chromatin compaction

Affiliations

H4K16 acetylation marks active genes and enhancers of embryonic stem cells, but does not alter chromatin compaction

Gillian C A Taylor et al. Genome Res. 2013 Dec.

Abstract

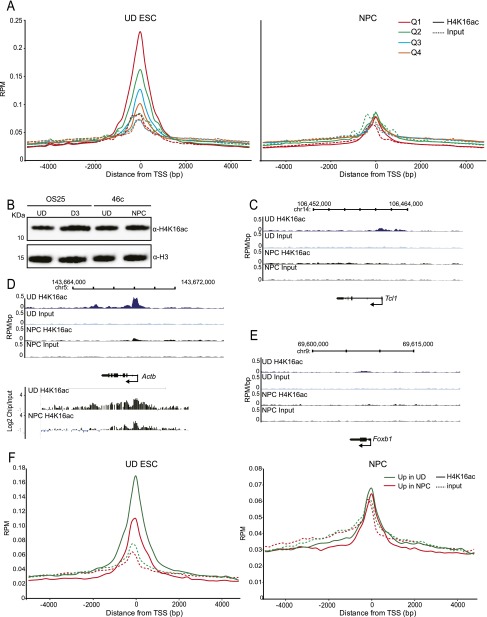
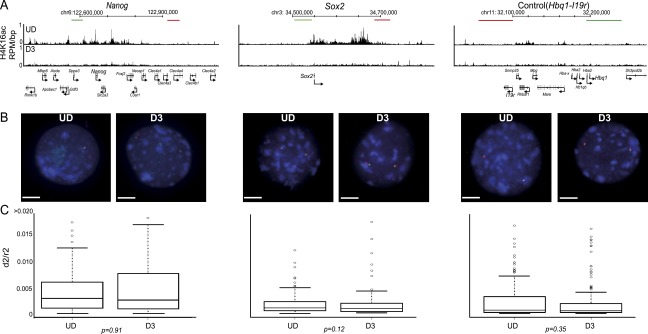
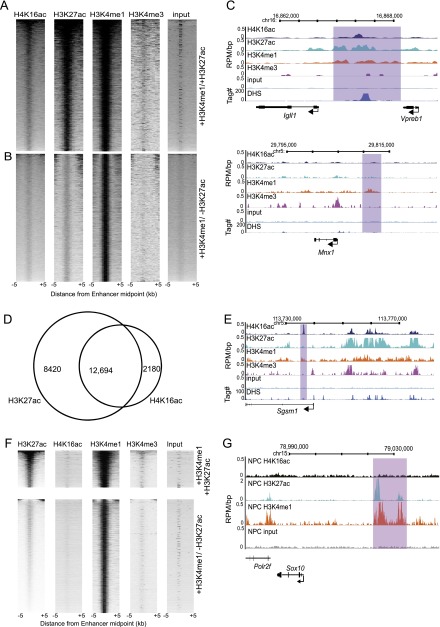
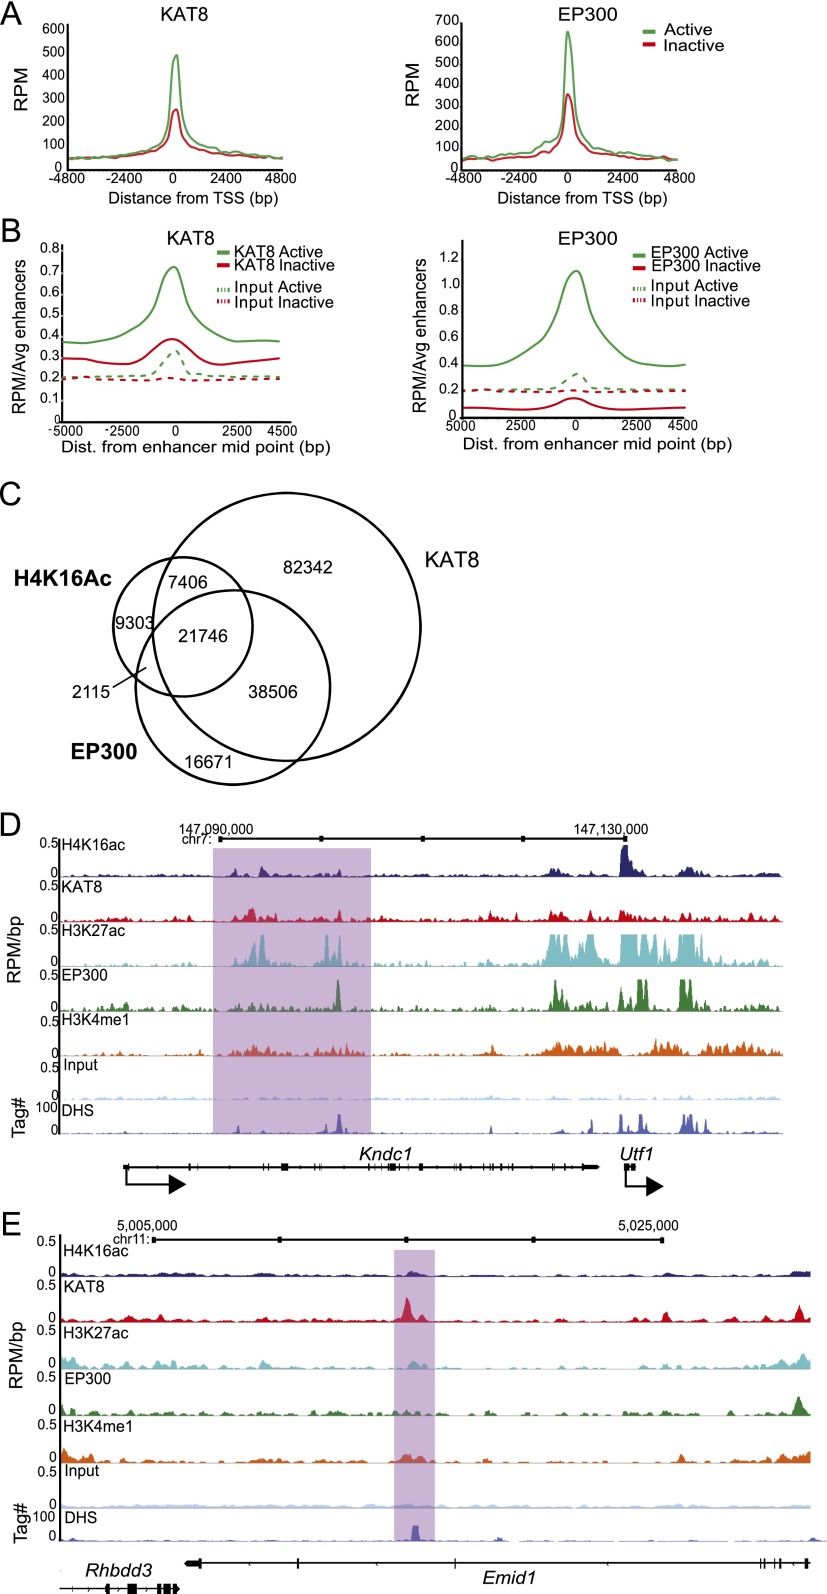
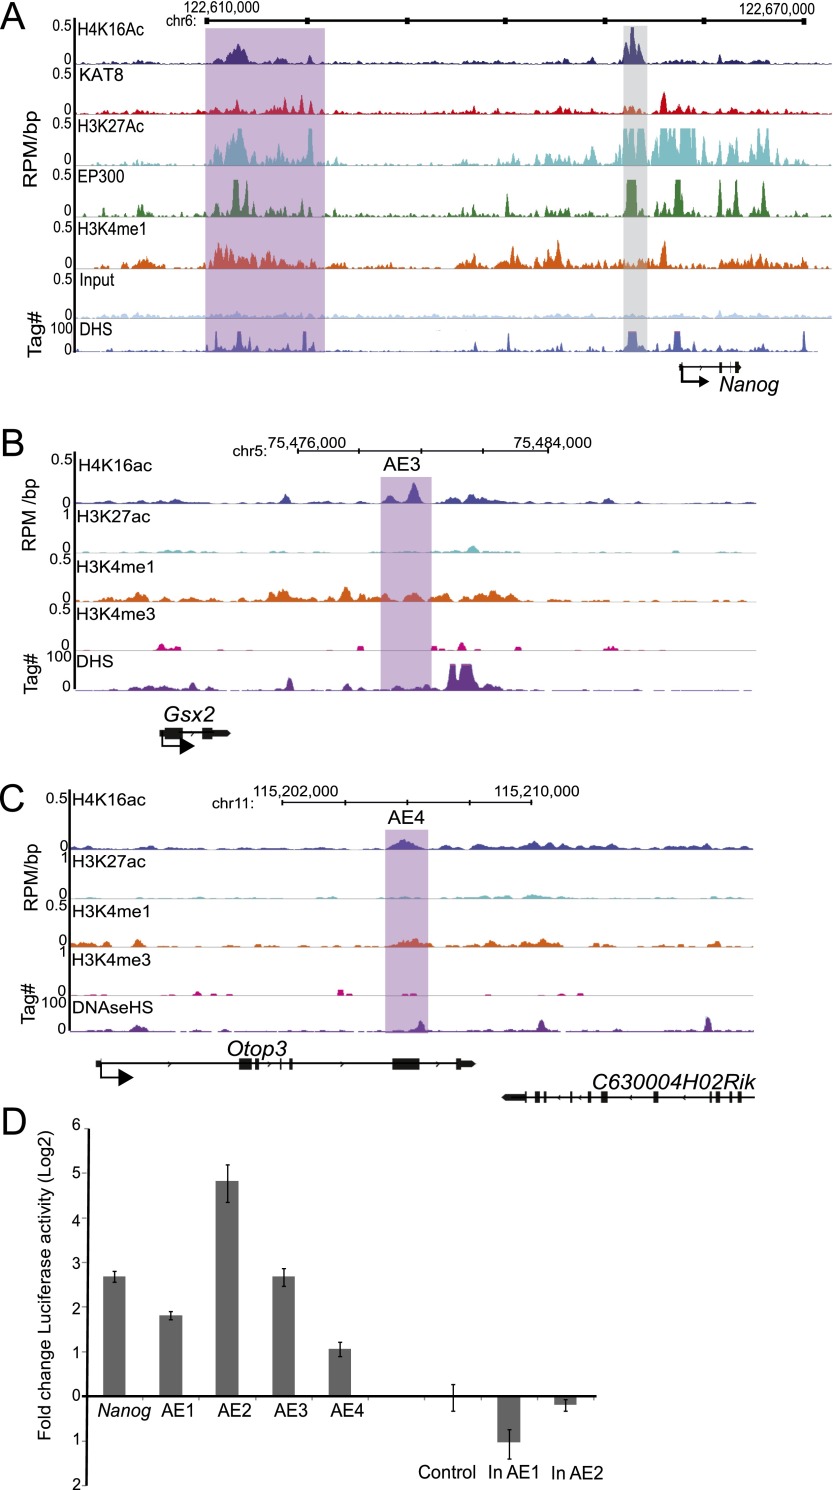
Compared with histone H3, acetylation of H4 tails has not been well studied, especially in mammalian cells. Yet, H4K16 acetylation is of particular interest because of its ability to decompact nucleosomes in vitro and its involvement in dosage compensation in flies. Here we show that, surprisingly, loss of H4K16 acetylation does not alter higher-order chromatin compaction in vivo in mouse embryonic stem cells (ESCs). As well as peaks of acetylated H4K16 and KAT8 histone acetyltransferase at the transcription start sites of expressed genes, we report that acetylation of H4K16 is a new marker of active enhancers in ESCs and that some enhancers are marked by H3K4me1, KAT8, and H4K16ac, but not by acetylated H3K27 or EP300, suggesting that they are novel EP300 independent regulatory elements. Our data suggest a broad role for different histone acetylation marks and for different histone acetyltransferases in long-range gene regulation.


Figures

Figure 1.
Figure 1.
Profile of H4K16 acetylation in undifferentiated ESCs. (A) Input normalized (average reads per million/RPM) H4K16ac native ChIP-seq tag counts around (±5 kb) the transcription start site (TSS) and transcription end site (TES) of genes separated into quartiles according to expression in ESC from high to low (Q1–Q4). (B, top) H4K16ac/H3K27ac/H3K4me3 profiles (RPM/bp), in 200-bp sliding windows with a 20-bp step, across the Actb (active) and Ifng (silent) loci. Exons are shown as boxes below the graph, and the direction of transcription is indicated. (Bottom) Log2 H4K16ac/input at Actb and Ifng established by hybridization of H4K16ac ChIP DNA to a custom microarray. (C) Average RPM/bp tag counts across gene bodies for 500 active (left) and inactive (right) genes (in intervals of 10% of gene length) and extending 2 kb upstream of the TSS, and 2 kb downstream (in 200-bp intervals). Data are for H4K16ac (blue), H3K4me3 (pink), and H3K36me3 (green). (D) Genomic distribution of H4K16ac, H3K27ac, and H3K4me3 peaks in ESCs, and 0.5 × 10⁶ peaks randomly distributed throughout the genome. (Left) Percentage of histone modification peaks found across each category of genomic sequence, relative to mm9 RefSeq genes. (Right) Schematic detailing the categorization (peaks classified as distal intergenic do not fall into any of the previous categories).
Figure 2.
Figure 2.
Gain and loss of H4K16 acetylation during ESC differentiation. (A) Normalized (average reads per million/RPM) H4K16ac (solid lines) or input (dotted lines) ChIP-seq tag counts around (±5 kb) the transcription start site (TSS) and transcription end site (TES) of genes separated into quartiles according to expression in ESC (left) or NPC (right) (from high to low [Q1–Q4]). (B) Western blot of H4K16ac in undifferentiated OS25 ESC, OS25 cells after 3 d of differentiation using retinoic acid (lanes 1 and 2), undifferentiated 46c ESC, and NPCs (lanes 3 and 4). Levels of H3 are shown for comparison. (C) UD H4K16ac, UD input, NPC H4K16ac, and NPC input profiles (RPM/bp), in 200-bp sliding windows with a 20-bp step, across the Tcl1 locus, which is silenced upon NPC differentiation. Exons are shown as boxes below the graph and the direction of transcription is indicated. (D) As in C, across the Actb locus, this maintains similarly high levels of expression in UD ESC and NPCs. At the bottom, log2 H4K16ac/input is shown at Actb established by hybridization to a custom microarray of ChIP DNA from 46c ESC and 46c NPC. Chromosome position and RefSeq gene annotations are used from July 2007 (mm9) mouse genome build (UCSC). (E) As in C, across the Foxb1 locus, this is silent in ESC, and highly expressed in NPCs. (F) RPM H4K16ac (solid lines) or input (dotted lines) ChIP-seq tag counts around (±5 kb) the TSS of genes differentially up-regulated in either ESC (ESC up genes, green lines) or NPC (NPC up genes, red lines). Data are shown for ESC (left) and NPC (right).
Figure 3.
Figure 3.
Loss of H4K16 acetylation does not correlate to chromatin compaction in vivo. (A) H4K16ac (RPM/bp in a 200-bp sliding window with a 20-bp step) across the Nanog, Sox2, and control (Hbq-Il9r) loci in undifferentiated ESC (UD, top row) and in differentiated cells (D3, bottom row). The position of fosmid probes (green and red boxes) used in FISH is indicated. Genomic maps are from the mm9 assembly of the mouse genome. (B) Example FISH images of nuclei from undifferentiated (UD; left) and differentiated (D3; left) ESCs, hybridized with probe pairs cross the Nanog, Sox2, and Hbq-Il9r loci. Nuclei were counterstained with DAPI (blue). Scale bar, 10 μm . (C) Boxplots indicating the distribution of squared interprobe distances (d2) normalized to nuclear radius2 (r2) for UD and D3 cells. Boxes show the median and interquartile range of the data; circles indicate outliers. n = 50 nuclei. Statistical significance of differences were examined by a Mann-Whitney U-test in R version 2.14.0.
Figure 4.
Figure 4.
H4K16ac is found on active enhancers. (A,B) Heatmaps of H4K16ac, H3K27ac, H3K4me1, H3K4me3, and input ChIP-seq data (RPM) at H3K4me1+/H3K27ac+ (A), and H3K4me1+/H3K27ac− (B) marked enhancers. Data are ranked by sum of hits in the H4K16ac data set; 10-kb window around enhancer midpoint, in 500-bp windows. Intensity is determined by RPM. (C) Histone modification profiles and DNase I hypersensitive sites (DHS) across (top) a genetically defined enhancer active in ES cells (Igll1-Vpreb1 loci) and (bottom) a neuron-specific enhancer (at Mnx1 locus) not active in ESCs. Purple box indicates the likely enhancer location. Histone modifications are shown as RPM/bp in 200-bp sliding windows with 20-bp step, DHS sites are shown as tag density in a 150-bp window with a 20-bp step. (D) Quantification of SICER defined H3K27ac+/H3K4me1+/H3K4me3-, and H4K16ac+/H3K4me1+/H3K4me3- peak overlap. Venn diagram illustrates number of clustered active enhancers marked by H4K16ac or H3K27ac alone, or both together. (E) Profiles of H4K16ac, H3K27ac, H3K4me1, and H3K4me3, at an example of an H4K16ac+/H3K27ac-/H3K4me1+ putative active enhancer. Histone modifications and DHS sites shown as in C. (F) Heatmaps of H4K16ac, H3K27ac, H3K4me1, H3K4me3, and input ChIP-seq data (RPM) at H3K4me1+/H3K27ac+ (top), and H3K4me1+/H3K27ac− (bottom) marked enhancers in NPCs. Data are ranked by sum of hits in the H3K27ac data set; 10-kb window around enhancer midpoint, in 500-bp windows. Intensity is determined by RPM. (G) Profiles of NPC H4K16ac, H3K27ac, H3K4me1, and H3K4me3, as an example of an enhancer active in neuronal cell types (Antonellis et al. 2008). Histone modifications and DHS sites shown as in C.
Figure 5.
Figure 5.
KAT8 is found on active enhancers. (A) RPM cross-linked ChIP-seq tag counts from ESCs around (±5 kb) the TSS and TES of active (green) and inactive (red) genes for KAT8 (left) and EP300 (right). (B) Average RPM per enhancer tag counts around the enhancer midpoint of active (H3K4me1+/H3K27ac+) or inactive enhancers for KAT8 (left) or EP300 (right) ChIP-seq (solid lines) or for input DNAs (dotted lines). (C) Quantification of SICER defined H4K16ac, KAT8, and EP300 peak overlap. Venn diagrams from left to right illustrate number of peaks overlapping between H4K16ac/KAT8, H4K16ac/EP300, and KAT8/EP300, respectively. (D) H4K16ac/KAT8/EP300/H3K27ac/ H3K4me1/ and H3K4me3 ChIP profiles from ESCs around the Kndc1-Utf1 locus. Data are shown as RPM per base pair (bp) in 200-bp sliding windows with a 20-bp step. Purple-shaded boxes indicate regions where the KAT8 distribution more closely mirrors that of H3K27ac than does EP300. (E) H4K16ac/KAT8/H3K27ac/EP300/H3K4me1/input and DHS profiles from ESCs across a potentially H4K16ac-specific active enhancer in the Emid1 locus. The peak of H4K16ac and KAT8 (purple-shaded area) corresponds to a strong DHS and a peak of H3K4me1, but not of EP300/H3K27ac.
Figure 6.
Figure 6.
H4K16ac peaks have enhancer activity. (A) H4K16ac/KAT8/H3K27ac/EP300/H3K4me1/input and DHS profiles from ES cells in the 5′ regulatory region upstream of Nanog. ChIP data are shown as RPM per base pair (bp) in 200-bp sliding windows with a 20-bp step. DHS sites are shown as tag density in a 150-bp window with a 20-bp step. Gray-shaded box indicates a genetically defined Nanog enhancer that is used for luciferase assay. (B,C) H4K16ac, H3K27ac, H3K4me1, and H3K4me3 profiles across enhancer downstream from (B) Gsx2 gene (AE3) and (C) in an intragenic region of Otop3 (AE4). ChIP data are shown as RPM per base pair (bp) in 200-bp sliding windows with a 20-bp step. DHS sites are shown as tag density in a 150-bp window with a 20-bp step. Purple-shaded areas correspond to regulatory regions with H4K16ac peaks but not H3K27ac, and these regions were cloned for enhancer reporter assay (D). (D) Enhancer reporter assay for genetically defined enhancer of Nanog (Nanog), and randomly chosen active enhancers based on H3K4me1 and H4K16ac peaks but not H3K27ac peaks (AE1–AE4). Regions with putative inactive enhancers containing H3K4me1 peaks, but neither H3K27ac nor H4K16ac (in AE1, in AE2) were also assayed. Empty vector pGL4.26 (Control) served as a negative control. Firefly luciferase activity was normalized to transfection efficiency with Renilla luciferase activity using pRL-TK, log2 fold change in luciferase activity was plotted with error bars showing standard error of mean from two biological and eight technical replicates (n = 8).

Similar articles

Cited by

References

    1. Allahverdi A, Yang R, Korolev N, Fan Y, Davey CA, Liu C-F, Nordenskiöld L 2011. The effects of histone H4 tail acetylations on cation-induced chromatin folding and self-association. Nucleic Acids Res 39: 1680–1691 - PMC - PubMed
    1. Antonellis A, Huynh JL, Lee-Lin SQ, Vinton RM, Renaud G, Loftus SK, Elliot G, Wolfsberg TG, Green ED, McCallion AS, et al. 2008. Identification of neural crest and glial enhancers at the mouse Sox10 locus through transgenesis in zebrafish. PLoS Genet 4: e1000174. - PMC - PubMed
    1. Bone JR, Lavender J, Richman R, Palmer MJ, Turner BM, Kuroda MI 1994. Acetylated histone H4 on the male X chromosome is associated with dosage compensation in Drosophila. Genes Dev 8: 96–104 - PubMed
    1. Cai Y, Jin J, Swanson SK, Cole MD, Choi SH, Florens L, Washburn MP, Conaway JW, Conaway RC 2010. Subunit composition and substrate specificity of a MOF-containing histone acetyltransferase distinct from the male-specific lethal (MSL) complex. J Biol Chem 285: 4268–4272 - PMC - PubMed
    1. Chambeyron S, Bickmore WA 2004. Chromatin decondensation and nuclear reorganization of the HoxB locus upon induction of transcription. Genes Dev 18: 1119–1130 - PMC - PubMed

Publication types

MeSH terms

Associated data