. 2013 Sep 23;210(10):1899-910.
doi: 10.1084/jem.20130084. Epub 2013 Aug 26.

The Nlrp3 inflammasome regulates acute graft-versus-host disease

Affiliations

The Nlrp3 inflammasome regulates acute graft-versus-host disease

Dragana Jankovic et al. J Exp Med. .

Abstract

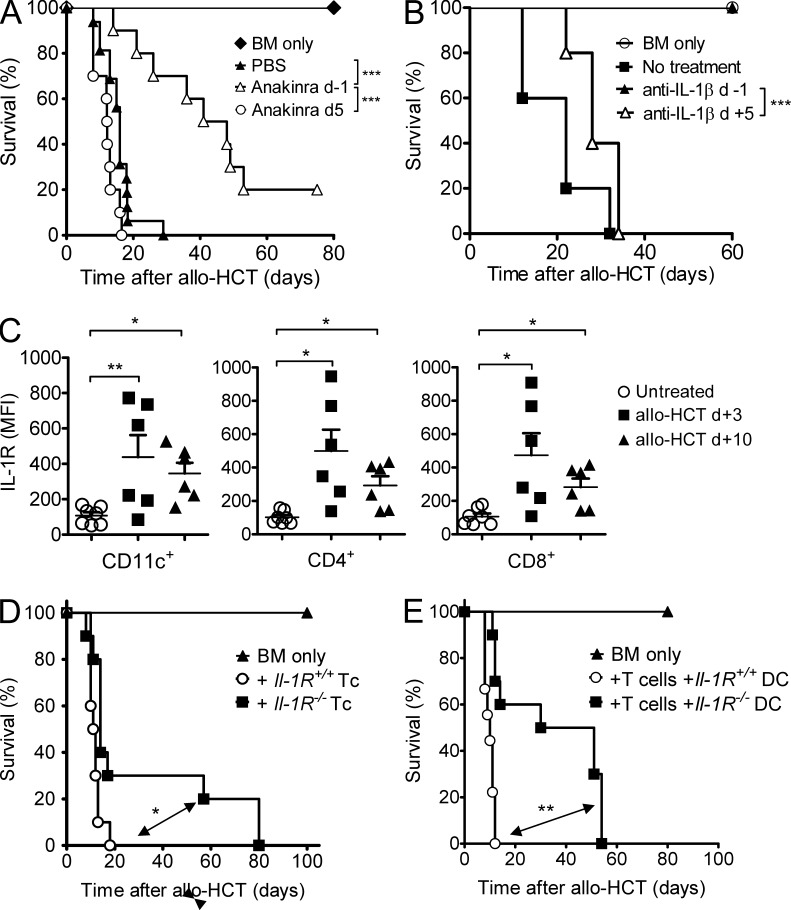
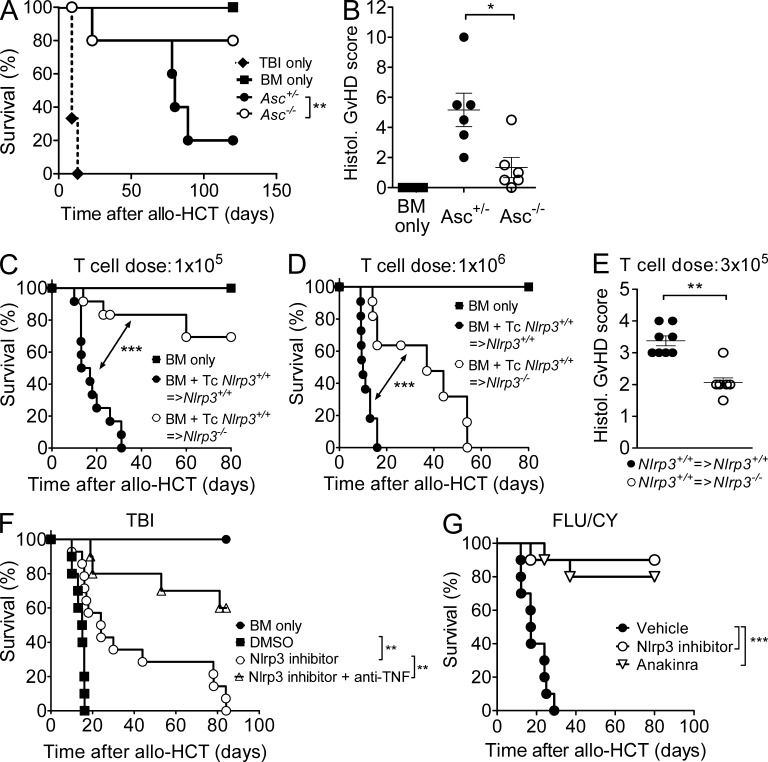
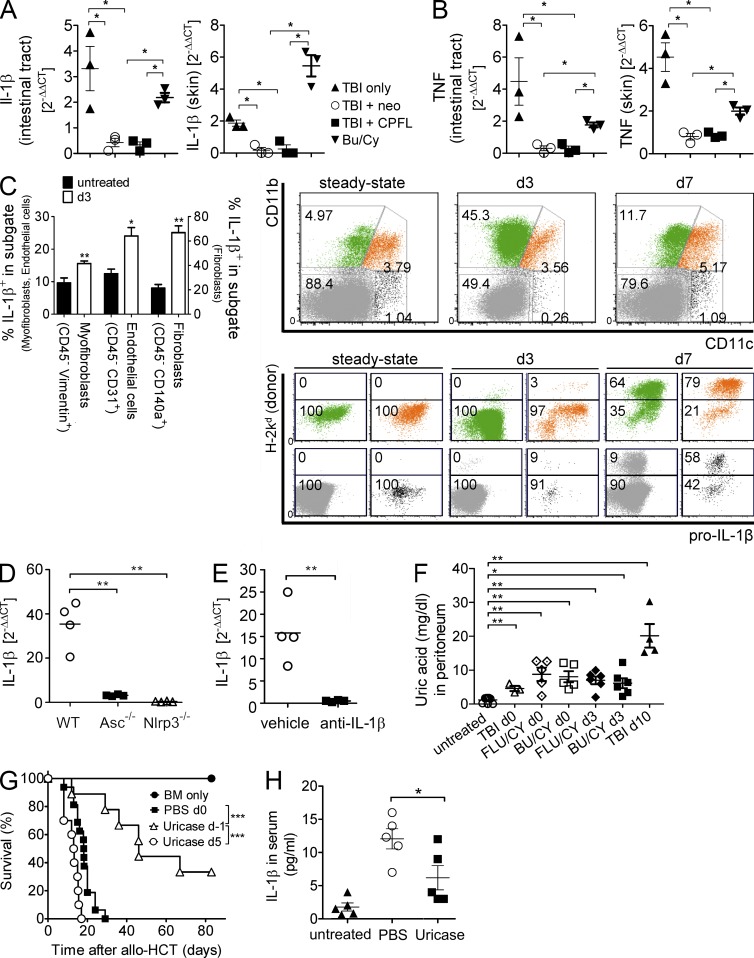
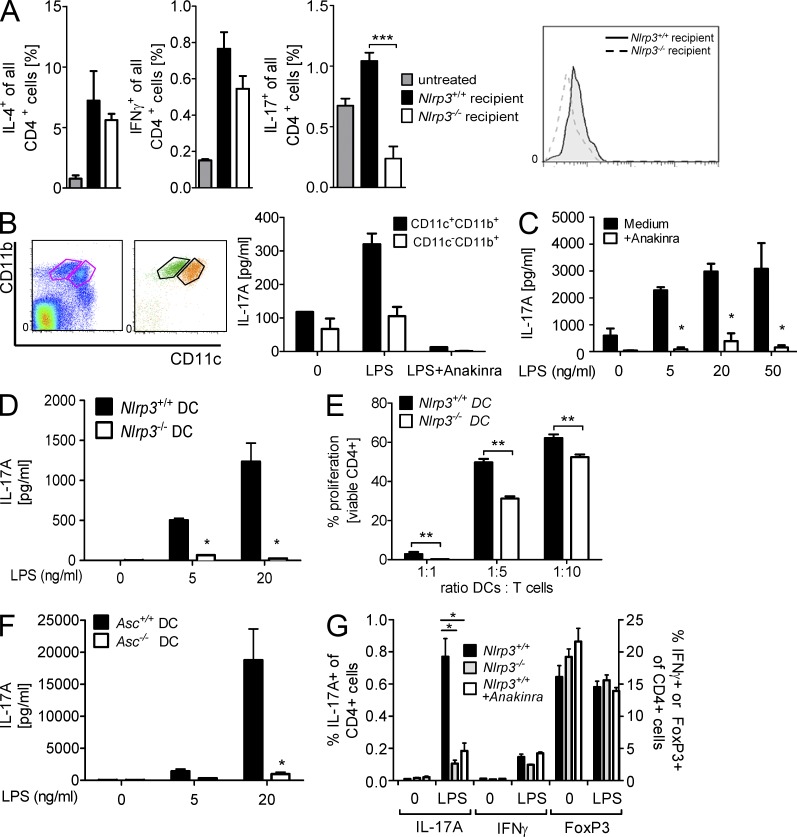
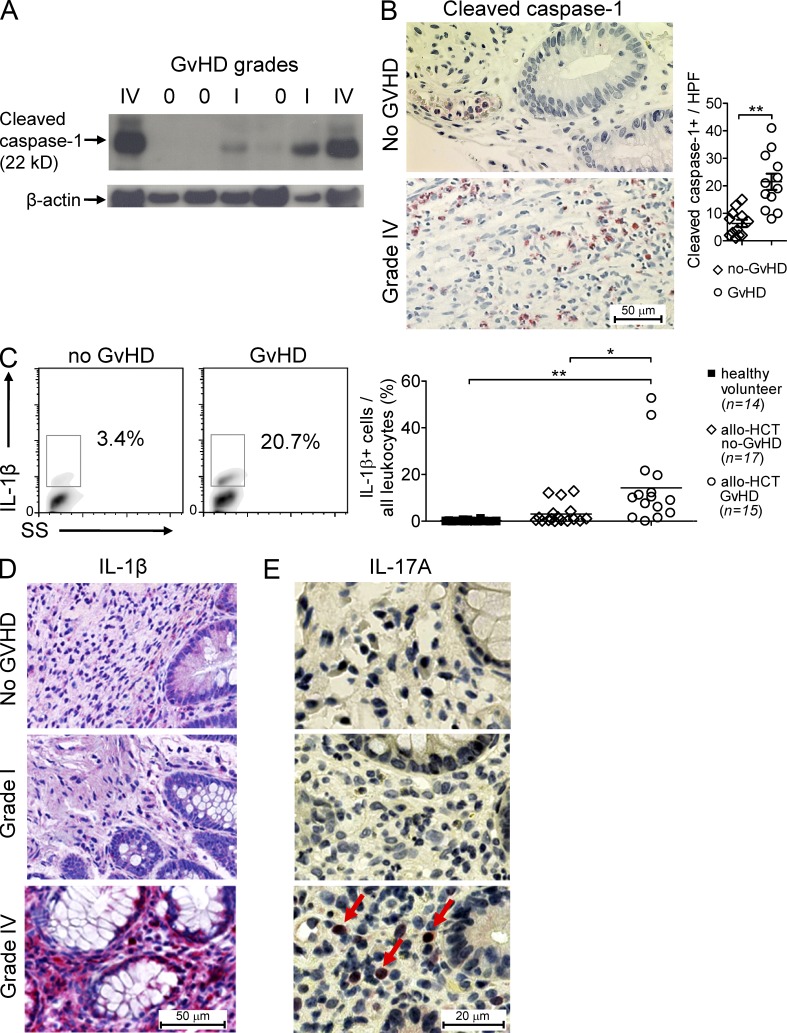
The success of allogeneic hematopoietic cell transplantation is limited by acute graft-versus-host disease (GvHD), a severe complication accompanied by high mortality rates. Yet, the molecular mechanisms initiating this disease remain poorly defined. In this study, we show that, after conditioning therapy, intestinal commensal bacteria and the damage-associated molecular pattern uric acid contribute to Nlrp3 inflammasome-mediated IL-1β production and that gastrointestinal decontamination and uric acid depletion reduced GvHD severity. Early blockade of IL-1β or genetic deficiency of the IL-1 receptor in dendritic cells (DCs) and T cells improved survival. The Nlrp3 inflammasome components Nlrp3 and Asc, which are required for pro-IL-1β cleavage, were critical for the full manifestation of GvHD. In transplanted mice, IL-1β originated from multiple intestinal cell compartments and exerted its effects on DCs and T cells, the latter being preferentially skewed toward Th17. Compatible with these mouse data, increased levels of active caspase-1 and IL-1β were found in circulating leukocytes and intestinal GvHD lesions of patients. Thus, the identification of a crucial role for the Nlrp3 inflammasome sheds new light on the pathogenesis of GvHD and opens a potential new avenue for the targeted therapy of this severe complication.


Figures

Figure 1.
Figure 1.
Proinflammatory IL-1β has effects on both T cells and DCs while receptor antagonism or depletion reduces acute GvHD related mortality. (A) BALB/c mice underwent TBI followed by transplantation with C57/BL6 BM alone (n = 10) or C57/BL6 BM plus T cells, and were monitored for survival. Where indicated, mice received either vehicle (PBS; n = 16) or Anakinra (n = 10 per group). Treatment was started on day −1 or +5, as indicated. The experiment was performed twice and the resulting survival data were pooled. (B) C57BL/6 mice underwent TBI followed by i.v. injection of C3H BM alone or C3H BM plus T cells and were monitored for survival. Where indicated, mice received either no treatment or an antagonistic anti–IL-1β antibody on day −1 or +5. The experiment was performed twice, and the resulting survival data were pooled. Survival of mice receiving anti–IL-1β antibody on day −1 versus day +5: P < 0.0001; n = 10 per group. (C) BALB/c mice underwent TBI followed by allo-HCT with C57/BL6 BM plus T cells. Expression of IL-1R on splenic donor type (H-2Kb+) CD4+, CD8+, and CD11c+ cells was analyzed by flow cytometry at the indicated time points after allo-HCT. Mean fluorescence intensity (MFI) is displayed for day 3 (filled square) and for day 10 (filled triangle) compared with the untreated group (open circle). Each data point represents an individual animal (n = 6 per group). The experiment was repeated twice and the resulting data were pooled. (D) BALB/c mice received TBI + C57/BL6 BM alone or with T cells from IL-1R+/+ (open circle) or IL-1R−/− (filled square) donors and were monitored for survival. The experiment was performed twice and the resulting survival data were pooled. IL-1R+/+ T cells versus IL-1R−/− T cells: P = 0.0102; n = 10 per group. (E) C57BL/6 mice underwent TBI followed by transplantation with BALB/c BM alone (n = 3) or BALB/c BM plus T cells (n = 10 per group). Mice that received T cells were additionally injected i.v. with DCs from IL-1R+/+ C57BL/6 mice (open circle) or DCs from IL-1R−/− C57BL/6 mice (filled square) on day 0. The experiment was performed twice, and the resulting survival data were pooled. DC IL-1R+/+ versus DC IL-1R−/−: P = 0.0002. ***, P < 0.0001; **, P < 0.001; *, P < 0.05.
Figure 2.
Figure 2.
GvHD severity is reduced when recipients lack Asc or Nlrp3. (A and B) Asc−/− or Asc+/− C57BL/6 mice (n = 6 per group) underwent TBI followed by allo-HCT with C3H BM plus T cells. As control groups, WT C57BL/6 mice that received TBI alone (n = 6) or TBI plus C3H BM (n = 6) were used. Graphs show survival curves after transplantation (A) and histopathological scoring (apoptosis, inflammation) of the GvHD target organs (small intestine, large intestine and liver) on d10 after transplantation (B). The experiment was performed three times with similar results. One representative experiment is shown. (C–E) Nlrp3−/− or Nlrp3+/+ C57BL/6 mice (n = 10–12 per group) underwent TBI followed by allo-HCT with BALB/c BM alone or BALB/c BM plus T cells. T cell doses were 105 (C), 106 (D), or 3 × 10⁵ (E) as indicated. Graphs show survival curves after transplantation (C and D) and histopathological scoring (apoptosis, inflammation) of the GvHD target organs (small intestine, large intestine, and liver) on day 10 after transplantation (E). The experiment was performed twice, and the resulting survival data were pooled. (F) C57BL/6 mice underwent TBI, followed by transplantation with BALB/c BM alone (n = 10) or BALB/c BM plus T cells and were monitored for survival. Treatment was performed with PBS (n = 10), the Nlrp3 inhibitor glibenclamide (n = 16), or glibenclamide plus the TNF inhibitor Etanercept (n = 10) as indicated. Treatment with glibenclamide was started on day 0, and treatment with Etanercept was started on day 5. The experiment was performed twice, and the resulting data were pooled. (G) BALB/c mice were conditioned with FLU/CY based chemotherapy, followed by transplantation with C57/BL6 BM plus T cells, and then monitored for survival. Treatment was performed with vehicle (DMSO, n = 10), glibenclamide (n = 10), or Anakinra (n = 10). ***, P < 0.0001; **, P < 0.005; *, P < 0.05.
Figure 3.
Figure 3.
Effects of TBI, chemotherapy, commensal bacteria, and uric acid on IL-1β/TNF production. (A and B) RNA from the intestines and skin of mice receiving TBI (9 Gy) or chemotherapy (BU/Cyclophosphamide) was isolated 24 h after conditioning, and the expression of IL-1β and TNF was determined by quantitative PCR (qPCR). Neomycin (neo) or Ciprofloxacin (CPFL) were given starting 7 d before TBI, as indicated. Each data point represents an individual animal (n = 3) and the experiment was repeated 3 times. (C, left) Intestinal tract cells were isolated on d7 after allo-HCT, and the amount of intracellular IL-1β production was determined in the indicated cell populations after stimulation with PMA/ionomycin for 3 h. Shown are pooled results of six mice per group. (C, right) C57BL/6 hosts were transplanted (TBI, BALB/c BM+ T cells) and sacrificed 3 or 7 d after transplantation or left untreated (steady state). LPLs were isolated and directly analyzed for expression of CD11b, CD11c, donor/recipient markers, and intracellular expression of pro–IL-1β by flow cytometry. Top graphs show myeloid subgating of live LPLs, bottom graphs show donor H2k expression versus pro–IL-1β of myeloid subpopulations from top row. Data from one of two independent experiments with similar results and multiple time point analyses are shown. (D) RNA from the intestines of mice receiving TBI was isolated after 24 h and the expression of IL-1β was determined by quantitative PCR (qPCR). Each data point represents an individual animal (n = 4). The experiment was performed 3 times with similar results. (E) C57BL/6 mice received anti–IL-1β antibody or vehicle 24h before TBI or control treatment. RNA from the small intestine was isolated 40 h after TBI, and the expression of IL-1β was determined by quantitative PCR (qPCR). Each data point represents an individual animal (n = 4). The experiment was performed three times, with similar results. (F) BALB/c mice underwent different conditioning regimes: TBI alone (day 0; n = 3) or followed by allo-HCT with C57/BL6 BM plus T cells (day 10; n = 4); BU/CY chemotherapy or FLU/CY chemotherapy alone (day 0, n = 5) or followed by allo-HCT with C57/BL6 BM plus T cells (day 3, n = 6) as indicated. Untreated mice (n = 9) served as control. At the indicated time points, peritoneal fluid was isolated and UA levels were determined. Each data point represents an individual animal, and the experiment was performed twice with similar results. (G) BALB/c mice underwent TBI followed by allo-HCT with C57/BL6 BM alone (n = 10) or C57/BL6 BM plus T cells. Mice were treated with PBS (n = 16) or uricase starting from day −1 forward or from day +5 forward (n = 10 per group), as indicated. The experiment was performed twice and the resulting survival data were pooled. (H) On day 3 after allo-HCT, serum was isolated from BALB/c mice that received treatment with PBS or uricase from day 0 forward. Serum IL-1β levels were determined by ELISA. ***, P = 0.0001; **, P < 0.01; *, P < 0.05.
Figure 4.
Figure 4.
Nlrp3/Asc deficiency or IL-1β antagonism causes lower IL-17A production and alloreactive T cell expansion. (A) Splenocytes were isolated from untreated mice (n = 4) or Nlrp3+/+ or Nlrp3−/− mice (n = 6 per group) receiving TBI+BM and T cells (BALB/c → C57BL/6 model) and analyzed for CD4+ T cell cytokine production by intracellular FACS staining after PMA/Ionomycin/Brefeldin A restimulation (left). A representative histogram of IL-17A–stained cells is shown (right). The experiment was performed two times with similar results. (B) Intestinal LPL from C57BL/6 mice were sorted into CD11b+CD11c and CD11b+CD11cmid populations. Sorting strategy and overlaid post-sorting FACS analysis of resulting CD11b+CD11c (green) or CD11b+CD11cmid (orange) populations are shown on the left. Cells were stimulated with or without LPS (20 ng/ml) and Anakinra (10 µg/ml) and co-incubated with BALB/c splenic CD4+ T cells. After 120 h, supernatants were analyzed for IL-17A. One representative of two independent experiments is shown. (C) BALB/c splenic CD4+ T cells were co-incubated with C57/BL6 GMCSF-DCs that were preexposed to increasing LPS concentrations with or without Anakinra (10 µg/ml). After 120 h of co-culture, the supernatant was analyzed for IL-17A by ELISA. One representative of four independent experiments is shown. (D) BALB/c naive splenic CD4+ T cells were incubated for 120 h with Nlrp3+/+ or Nlrp3−/− GMCSF-DC that were preexposed to LPS at different concentrations and the supernatant was analyzed for IL-17A by ELISA. One representative of four independent experiments is shown. (E) CFSE-labeled BALB/c CD4+ T cells were co-cultured with LPS preexposed DC from Nlrp3+/+ or Nlrp3−/− mice at different ratios for 96 h. One representative of four independent experiments is shown. (F) BALB/c splenic CD4+ T cells were incubated for 120 h with Asc+/+ or Asc−/− GMCSF-DC that were preexposed to LPS at different concentrations and the supernatant was analyzed for IL-17A by ELISA. One representative of four independent experiments is shown. (G) T cells, as in D, were restimulated with PMA (1 µM), ionomycin (100 nM), and Brefeldin A after co-culture with unprimed or 20 ng/ml LPS-primed DCs (Nlrp3+/+, Nlrp3−/−, or Anakinra-treated Nlrp3+/+) and analyzed by FACS for intracellular IL-17A, IFN-γ, and FoxP3. One representative of three independent experiments is shown. ***, P < 0.0001; **, P < 0.001; *, P < 0.05.
Figure 5.
Figure 5.
IL-1β and cleaved caspase-1 are found at high levels in human tissues of patients developing acute GvHD. (A) The presence of cleaved caspase-1 was determined in PBMCs from patients undergoing allo-HCT after stimulation with LPS (50 ng/ml) for 6 h. GvHD severity is indicated above the individual patient sample. (B) The amount of cleaved caspase-1 was determined by immunohistochemistry of intestinal biopsies derived from patients with or without GvHD. The cleaved caspase-1–positive cells were quantified by counting positive cells per high power field (HPF). (C) The amount of IL-1β was determined in freshly isolated PBMCs from healthy volunteers or patients undergoing allo-HCT and correlated with the incidence of acute GvHD. The left panel represents a representative flow cytometry plot; the diagram on the right shows the quantification for all individuals. Each data point represents an individual (n = 14–17 per group). (D) Immunohistochemical staining for IL-1β was performed on intestinal biopsies and correlated with the severity of acute GvHD. One representative sample is shown. (E) Immunohistochemical staining for IL-17A was performed on intestinal biopsies and correlated with the severity of acute GvHD. One representative sample is shown. **, P < 0.005; *, P < 0.05.

Similar articles

Cited by

References

    1. Akira S., Takeda K. 2004. Toll-like receptor signalling. Nat. Rev. Immunol. 4:499–511 http://www.nature.com/nri/journal/v4/n7/full/nri1391.html - PubMed
    1. Beelen D.W., Elmaagacli A., Müller K.D., Hirche H., Schaefer U.W. 1999. Influence of intestinal bacterial decontamination using metronidazole and ciprofloxacin or ciprofloxacin alone on the development of acute graft-versus-host disease after marrow transplantation in patients with hematologic malignancies: final results and long-term follow-up of an open-label prospective randomized trial. Blood. 93:3267–3275 - PubMed
    1. Bryson J.S., Zhang L., Goes S.W., Jennings C.D., Caywood B.E., Carlson S.L., Kaplan A.M. 2004. CD4+ T cells mediate murine syngeneic graft-versus-host disease-associated colitis. J. Immunol. 172:679–687 - PubMed
    1. Coccia M., Harrison O.J., Schiering C., Asquith M.J., Becher B., Powrie F., Maloy K.J. 2012. IL-1β mediates chronic intestinal inflammation by promoting the accumulation of IL-17A secreting innate lymphoid cells and CD4(+) Th17 cells. J. Exp. Med. 209:1595–1609 10.1084/jem.20111453 - DOI - PMC - PubMed
    1. Davis B.K., Wen H., Ting J.P. 2011. The inflammasome NLRs in immunity, inflammation, and associated diseases. Annu. Rev. Immunol. 29:707–735 10.1146/annurev-immunol-031210-101405 - DOI - PMC - PubMed

Publication types

MeSH terms