

Micropatterned dermal-epidermal regeneration matrices create functional niches that enhance epidermal morphogenesis
- PMID: 23958778
- PMCID: PMC3818337
- DOI: 10.1016/j.actbio.2013.08.017
Micropatterned dermal-epidermal regeneration matrices create functional niches that enhance epidermal morphogenesis
Abstract
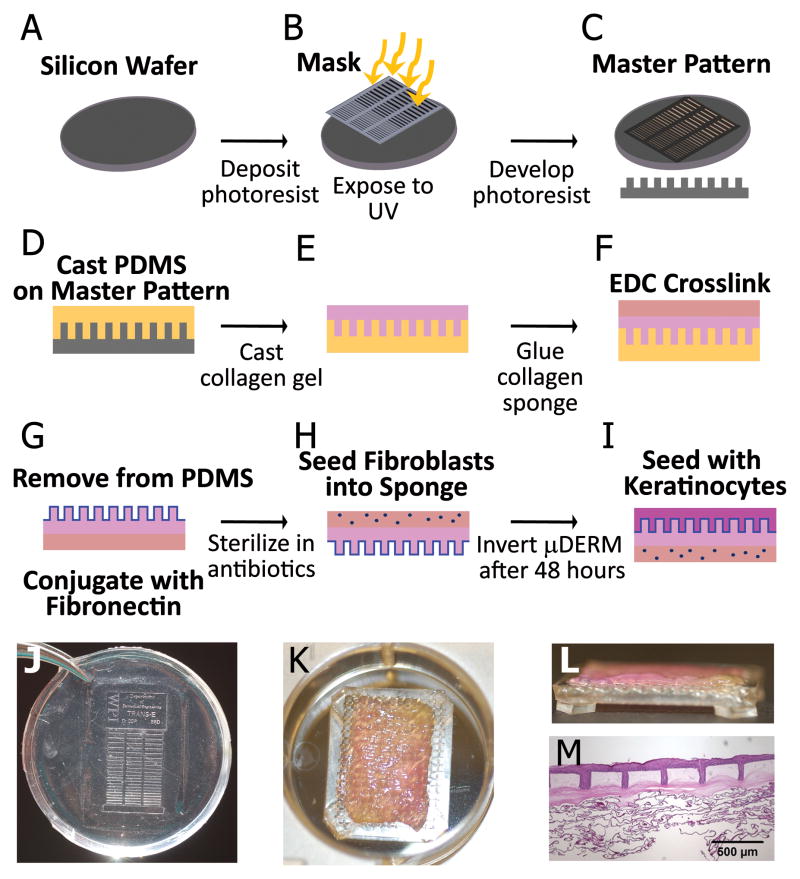
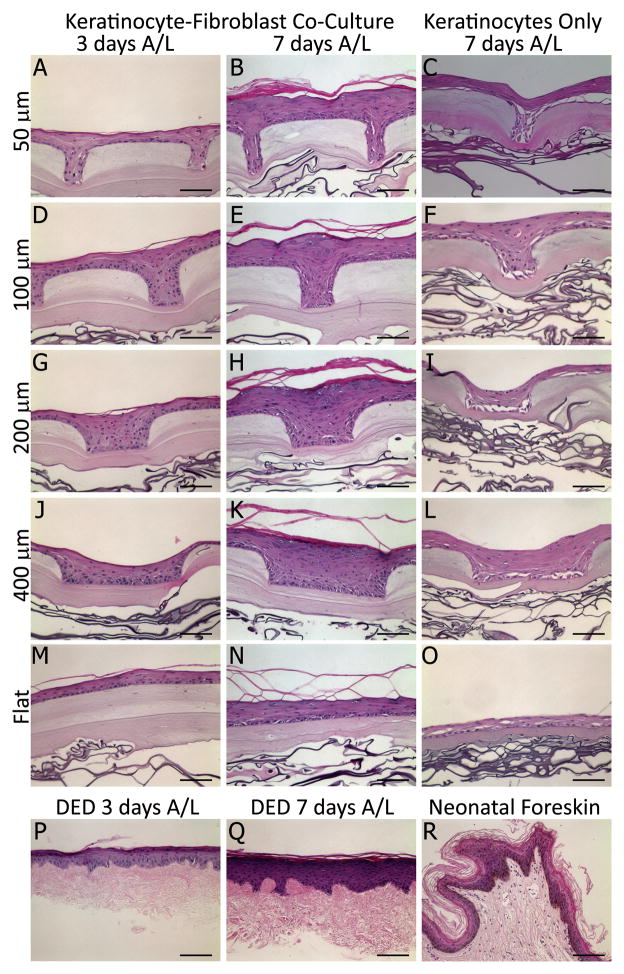
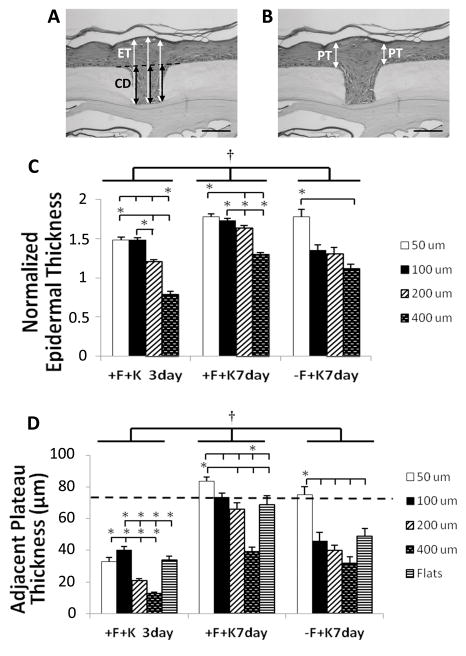
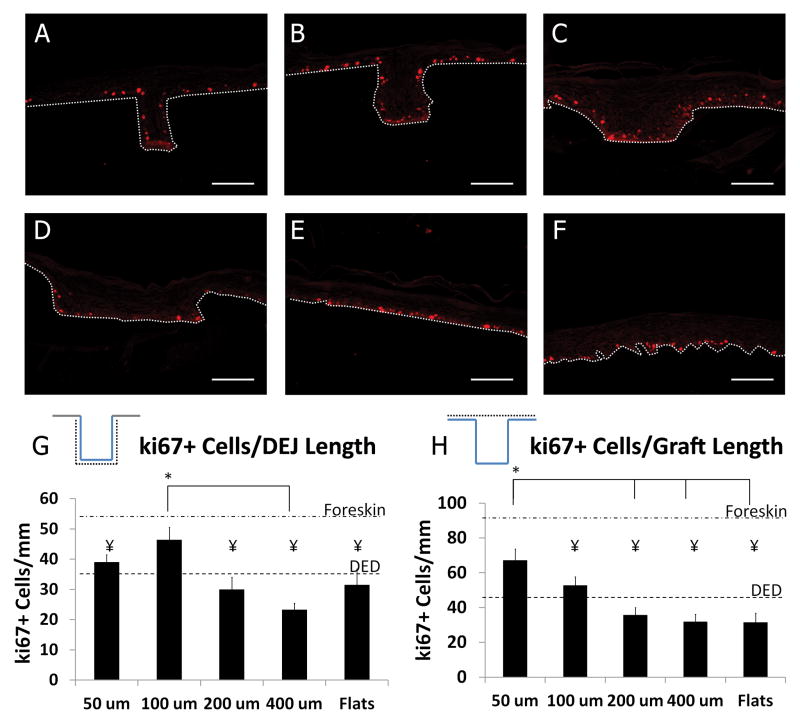
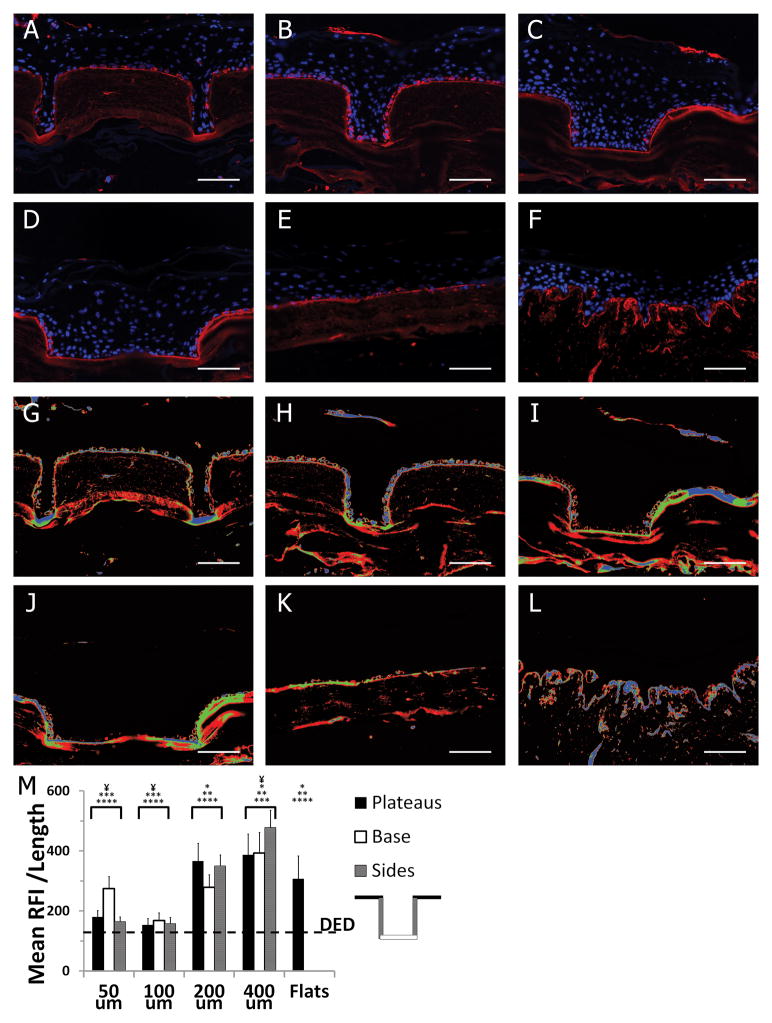
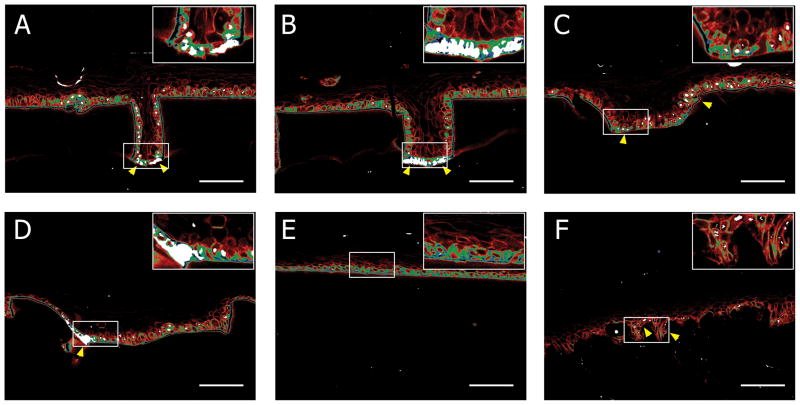
Although tissue engineered skin substitutes have demonstrated some clinical success for the treatment of chronic wounds such as diabetic and venous ulcers, persistent graft take and stability remain concerns. Current bilayered skin substitutes lack the characteristic microtopography of the dermal-epidermal junction that gives skin enhanced mechanical stability and creates cellular microniches that differentially promote keratinocyte function to form skin appendages and enhance wound healing. We developed a novel micropatterned dermal-epidermal regeneration matrix (μDERM) which incorporates this complex topography and substantially enhances epidermal morphology. Here, we describe the use of this three-dimensional (3-D) in vitro culture model to systematically evaluate different topographical geometries and to determine their relationship to keratinocyte function. We identified three distinct keratinocyte functional niches: the proliferative niche (narrow geometries), the basement membrane protein synthesis niche (wide geometries) and the putative keratinocyte stem cell niche (narrow geometries and corners). Specifically, epidermal thickness and keratinocyte proliferation is significantly (p<0.05) increased in 50 and 100 μm channels while laminin-332 deposition is significantly (p<0.05) increased in 400 μm channels compared to flat controls. Additionally, β1(bri)p63(+) keratinocytes, putative keratinocyte stem cells, preferentially cluster in channel geometries (similar to clustering observed in native skin) compared to a random distribution on flats. This study identifies specific target geometries to enhance skin regeneration and graft performance. Furthermore, these results suggest the importance of μDERM microtopography in designing the next generation of skin substitutes. Finally, we anticipate that 3-D organotypic cultures on μDERMS will provide a novel tissue engineered skin substitute for in vitro investigations of skin morphogenesis, wound healing and pathology.
Keywords: 3-D organ model; Dermal–epidermal junction; Keratinocyte function; Microtopography.
Copyright © 2013 Acta Materialia Inc. All rights reserved.
Conflict of interest statement
The authors state no conflict of interest.
Figures
Similar articles
-
Development of microfabricated dermal epidermal regenerative matrices to evaluate the role of cellular microenvironments on epidermal morphogenesis.Tissue Eng Part A. 2012 Nov;18(21-22):2343-53. doi: 10.1089/ten.TEA.2011.0479. Epub 2012 Jul 30. Tissue Eng Part A. 2012. PMID: 22724677 Free PMC article.
-
Authentic fibroblast matrix in dermal equivalents normalises epidermal histogenesis and dermoepidermal junction in organotypic co-culture.Eur J Cell Biol. 2004 Dec;83(11-12):631-45. doi: 10.1078/0171-9335-00435. Eur J Cell Biol. 2004. PMID: 15679108
-
Superficial dermal fibroblasts enhance basement membrane and epidermal barrier formation in tissue-engineered skin: implications for treatment of skin basement membrane disorders.Tissue Eng Part A. 2014 Feb;20(3-4):540-52. doi: 10.1089/ten.TEA.2013.0160. Epub 2013 Oct 17. Tissue Eng Part A. 2014. PMID: 24004160 Free PMC article.
-
The importance of laminin 5 in the dermal-epidermal basement membrane.J Dermatol Sci. 2000 Dec;24 Suppl 1:S51-9. doi: 10.1016/s0923-1811(00)00142-0. J Dermatol Sci. 2000. PMID: 11137397 Review.
-
Diversity of fibroblasts--a review on implications for skin tissue engineering.Cells Tissues Organs. 2008;187(3):165-76. doi: 10.1159/000111805. Epub 2007 Nov 28. Cells Tissues Organs. 2008. PMID: 18042973 Review.
Cited by
-
Dynamic Culture Substrates That Mimic the Topography of the Epidermal-Dermal Junction.Tissue Eng Part A. 2019 Feb;25(3-4):214-223. doi: 10.1089/ten.TEA.2018.0125. Epub 2018 Dec 28. Tissue Eng Part A. 2019. PMID: 30280972 Free PMC article.
-
Advances in tissue engineering and biofabrication for in vitro skin modeling.Bioprinting. 2023 Nov;35:e00306. doi: 10.1016/j.bprint.2023.e00306. Epub 2023 Sep 1. Bioprinting. 2023. PMID: 38645432 Free PMC article.
-
Evaluation of a bilayered, micropatterned hydrogel dressing for full-thickness wound healing.Exp Biol Med (Maywood). 2016 May;241(9):986-95. doi: 10.1177/1535370216640943. Epub 2016 Mar 31. Exp Biol Med (Maywood). 2016. PMID: 27037279 Free PMC article.
-
Incorporating redox-sensitive nanogels into bioabsorbable nanofibrous membrane to acquire ROS-balance capacity for skin regeneration.Bioact Mater. 2021 Mar 21;6(10):3461-3472. doi: 10.1016/j.bioactmat.2021.03.009. eCollection 2021 Oct. Bioact Mater. 2021. PMID: 33817421 Free PMC article.
-
Ultrastructural morphology is distinct among primary progenitor cell isolates from normal, inflamed, and cryopreserved equine hoof tissue and CD105+K14+ progenitor cells.In Vitro Cell Dev Biol Anim. 2019 Sep;55(8):641-655. doi: 10.1007/s11626-019-00380-1. Epub 2019 Jul 11. In Vitro Cell Dev Biol Anim. 2019. PMID: 31297697 Free PMC article.
References
-
- Macri L, Clark RA. Tissue engineering for cutaneous wounds: selecting the proper time and space for growth factors, cells and the extracellular matrix. Skin Pharmacol Physiol. 2009;22:83–93. - PubMed
-
- Carlson B. BioMarket Trends: Phalanx of Treatments Propels Burn Market: Recombinant Growth Factor Theapies Are Predicted to Be Up-and-Coming Players. Genetic Engineering and Biotechnology News. 2008
-
- Boyce ST. Design principles for composition and performance of cultured skin substitutes. Burns. 2001;27:523–33. - PubMed
-
- Sheridan RL, Tompkins RG. Skin substitutes in burns. Burns. 1999;25:97–103. - PubMed
Publication types
MeSH terms
Substances
Grants and funding
LinkOut - more resources
Full Text Sources
Other Literature Sources
