Gag-positive reservoir cells are susceptible to HIV-specific cytotoxic T lymphocyte mediated clearance in vitro and can be detected in vivo [corrected]
- PMID: 23951263
- PMCID: PMC3737195
- DOI: 10.1371/journal.pone.0071879
Gag-positive reservoir cells are susceptible to HIV-specific cytotoxic T lymphocyte mediated clearance in vitro and can be detected in vivo [corrected]
Erratum in
- PLoS One. 2013;8(9). doi:10.1371/annotation/3aa92c3d-b6dd-4c6e-8cee-9587ce80a9c9
Abstract
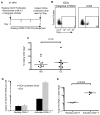
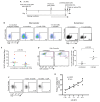
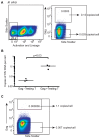
Resting CD4+T cells infected with HIV persist in the presence of suppressive anti-viral therapy (ART) and are barriers to a cure. One potential curative approach, therapeutic vaccination, is fueled by recognition of the ability of a subset of elite controllers (EC) to control virus without therapy due to robust anti-HIV immune responses. Controllers have low levels of integrated HIV DNA and low levels of replication competent virus, suggesting a small reservoir. As our recent data indicates some reservoir cells can produce HIV proteins (termed GPR cells for Gag-positive reservoir cells), we hypothesized that a fraction of HIV-expressing resting CD4+T cells could be efficiently targeted and cleared in individuals who control HIV via anti-HIV cytotoxic T lymphocytes (CTL). To test this we examined if superinfected resting CD4+T cells from EC express HIV Gag without producing infectious virus and the susceptibility of these cells to CTL. We found that resting CD4+T cells expressed HIV Gag and were cleared by autologous CD8+T cells from EC. Importantly, we found the extent of CTL clearance in our in vitro assay correlates with in vivo reservoir size and that a population of Gag expressing resting CD4+T cells exists in vivo in patients well controlled on therapy.
Conflict of interest statement
Figures


Similar articles
-
Control of HIV-1 Pathogenesis in Viremic Nonprogressors Is Independent of Gag-Specific Cytotoxic T Lymphocyte Responses.J Virol. 2018 May 29;92(12):e00346-18. doi: 10.1128/JVI.00346-18. Print 2018 Jun 15. J Virol. 2018. PMID: 29593044 Free PMC article.
-
Broad CTL response is required to clear latent HIV-1 due to dominance of escape mutations.Nature. 2015 Jan 15;517(7534):381-5. doi: 10.1038/nature14053. Epub 2015 Jan 7. Nature. 2015. PMID: 25561180 Free PMC article.
-
Suppression of HIV replication in the resting CD4+ T cell reservoir by autologous CD8+ T cells: implications for the development of therapeutic strategies.Proc Natl Acad Sci U S A. 2001 Jan 2;98(1):253-8. doi: 10.1073/pnas.98.1.253. Proc Natl Acad Sci U S A. 2001. PMID: 11136258 Free PMC article.
-
Differential Gag-specific polyfunctional T cell maturation patterns in HIV-1 elite controllers.J Virol. 2012 Apr;86(7):3667-74. doi: 10.1128/JVI.07034-11. Epub 2012 Jan 25. J Virol. 2012. PMID: 22278254 Free PMC article.
-
Virus-specific cytotoxic T lymphocyte responses in patients infected with the human immunodeficiency virus, HIV-1.Cell Mol Biol (Noisy-le-grand). 1994;40 Suppl 1:45-8. Cell Mol Biol (Noisy-le-grand). 1994. PMID: 7950861 Review.
Cited by
-
New Frontiers in Measuring and Characterizing the HIV Reservoir.Front Microbiol. 2019 Dec 18;10:2878. doi: 10.3389/fmicb.2019.02878. eCollection 2019. Front Microbiol. 2019. PMID: 31921056 Free PMC article. Review.
-
Immune mobilising T cell receptors redirect polyclonal CD8+ T cells in chronic HIV infection to form immunological synapses.Sci Rep. 2022 Nov 1;12(1):18366. doi: 10.1038/s41598-022-23228-3. Sci Rep. 2022. PMID: 36319836 Free PMC article.
-
Combination strategies to durably suppress HIV-1: Soluble T cell receptors.J Virus Erad. 2022 Aug 24;8(3):100082. doi: 10.1016/j.jve.2022.100082. eCollection 2022 Sep. J Virus Erad. 2022. PMID: 36065296 Free PMC article.
-
A Subset of Latency-Reversing Agents Expose HIV-Infected Resting CD4+ T-Cells to Recognition by Cytotoxic T-Lymphocytes.PLoS Pathog. 2016 Apr 15;12(4):e1005545. doi: 10.1371/journal.ppat.1005545. eCollection 2016 Apr. PLoS Pathog. 2016. PMID: 27082643 Free PMC article.
-
Measuring integrated HIV DNA ex vivo and in vitro provides insights about how reservoirs are formed and maintained.Retrovirology. 2018 Feb 17;15(1):22. doi: 10.1186/s12977-018-0396-3. Retrovirology. 2018. PMID: 29452580 Free PMC article. Review.
References
-
- Chun TW, Engel D, Berrey MM, Shea T, Corey L et al. (1998) Early establishment of a pool of latently infected, resting CD4(+) T cells during primary HIV-1 infection. Proc Natl Acad Sci U S A 95: 8869-8873. doi:10.1073/pnas.95.15.8869. PubMed: 9671771. - DOI - PMC - PubMed
-
- Siliciano JD, Kajdas J, Finzi D, Quinn TC, Chadwick K et al. (2003) Long-term follow-up studies confirm the stability of the latent reservoir for HIV-1 in resting CD4+ T cells. Nat Med 9: 727-728. doi:10.1038/nm880. PubMed: 12754504. - DOI - PubMed
-
- Finzi D, Blankson J, Siliciano JD, Margolick JB, Chadwick K et al. (1999) Latent infection of CD4+ T cells provides a mechanism for lifelong persistence of HIV-1, even in patients on effective combination therapy. Nat Med 5: 512-517. doi:10.1038/8394. PubMed: 10229227. - DOI - PubMed
-
- Chun TW, Carruth L, Finzi D, Shen X, DiGiuseppe JA et al. (1997) Quantification of latent tissue reservoirs and total body viral load in HIV-1 infection. Nature 387: 183-188. doi:10.1038/387183a0. PubMed: 9144289. - DOI - PubMed
-
- Chun TW, Finzi D, Margolick J, Chadwick K, Schwartz D et al. (1995) In vivo fate of HIV-1-infected T cells: quantitative analysis of the transition to stable latency. Nat Med 1: 1284-1290. doi:10.1038/nm1295-1284. PubMed: 7489410. - DOI - PubMed
Publication types
MeSH terms
Substances
Grants and funding
LinkOut - more resources
Full Text Sources
Other Literature Sources
Research Materials

