Dual split protein-based fusion assay reveals that mutations to herpes simplex virus (HSV) glycoprotein gB alter the kinetics of cell-cell fusion induced by HSV entry glycoproteins
- PMID: 23946457
- PMCID: PMC3807322
- DOI: 10.1128/JVI.01700-13
Dual split protein-based fusion assay reveals that mutations to herpes simplex virus (HSV) glycoprotein gB alter the kinetics of cell-cell fusion induced by HSV entry glycoproteins
Abstract
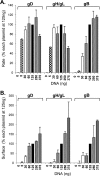
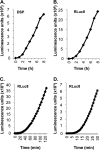
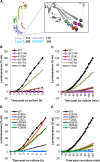
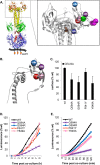
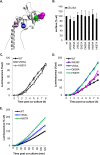
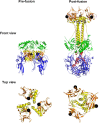
Herpes simplex virus (HSV) entry and cell-cell fusion require glycoproteins gD, gH/gL, and gB. We propose that receptor-activated changes to gD cause it to activate gH/gL, which then triggers gB into an active form. We employed a dual split-protein (DSP) assay to monitor the kinetics of HSV glycoprotein-induced cell-cell fusion. This assay measures content mixing between two cells, i.e., fusion, within the same cell population in real time (minutes to hours). Titration experiments suggest that both gD and gH/gL act in a catalytic fashion to trigger gB. In fact, fusion rates are governed by the amount of gB on the cell surface. We then used the DSP assay to focus on mutants in two functional regions (FRs) of gB, FR1 and FR3. FR1 contains the fusion loops (FL1 and FL2), and FR3 encompasses the crown at the trimer top. All FL mutants initiated fusion very slowly, if at all. However, the fusion rates caused by some FL2 mutants increased over time, so that total fusion by 8 h looked much like that of the WT. Two distinct kinetic patterns, "slow and fast," emerged for mutants in the crown of gB (FR3), again showing differences in initiation and ongoing fusion. Of note are the fusion kinetics of the gB syn mutant (LL871/872AA). Although this mutant was originally included as an ongoing high-rate-of-fusion control, its initiation of fusion is so rapid that it appears to be on a "hair trigger." Thus, the DSP assay affords a unique way to examine the dynamics of HSV glycoprotein-induced cell fusion.
Figures


Similar articles
-
Multiple Sites on Glycoprotein H (gH) Functionally Interact with the gB Fusion Protein to Promote Fusion during Herpes Simplex Virus (HSV) Entry.mBio. 2023 Feb 28;14(1):e0336822. doi: 10.1128/mbio.03368-22. Epub 2023 Jan 11. mBio. 2023. PMID: 36629412 Free PMC article.
-
Regulation of herpes simplex virus gB-induced cell-cell fusion by mutant forms of gH/gL in the absence of gD and cellular receptors.mBio. 2013 Feb 26;4(2):e00046-13. doi: 10.1128/mBio.00046-13. mBio. 2013. PMID: 23443004 Free PMC article.
-
Regulation of Herpes Simplex Virus Glycoprotein-Induced Cascade of Events Governing Cell-Cell Fusion.J Virol. 2016 Nov 14;90(23):10535-10544. doi: 10.1128/JVI.01501-16. Print 2016 Dec 1. J Virol. 2016. PMID: 27630245 Free PMC article.
-
Using a split luciferase assay (SLA) to measure the kinetics of cell-cell fusion mediated by herpes simplex virus glycoproteins.Methods. 2015 Nov 15;90:68-75. doi: 10.1016/j.ymeth.2015.05.021. Epub 2015 May 26. Methods. 2015. PMID: 26022509 Free PMC article. Review.
-
The Role of HSV Glycoproteins in Mediating Cell Entry.Adv Exp Med Biol. 2018;1045:3-21. doi: 10.1007/978-981-10-7230-7_1. Adv Exp Med Biol. 2018. PMID: 29896660 Review.
Cited by
-
Localization of the Interaction Site of Herpes Simplex Virus Glycoprotein D (gD) on the Membrane Fusion Regulator, gH/gL.J Virol. 2020 Sep 29;94(20):e00983-20. doi: 10.1128/JVI.00983-20. Print 2020 Sep 29. J Virol. 2020. PMID: 32759318 Free PMC article.
-
Epstein-Barr Virus Fusion with Epithelial Cells Triggered by gB Is Restricted by a gL Glycosylation Site.J Virol. 2017 Nov 14;91(23):e01255-17. doi: 10.1128/JVI.01255-17. Print 2017 Dec 1. J Virol. 2017. PMID: 28956769 Free PMC article.
-
Using Antibodies and Mutants To Localize the Presumptive gH/gL Binding Site on Herpes Simplex Virus gD.J Virol. 2018 Nov 27;92(24):e01694-18. doi: 10.1128/JVI.01694-18. Print 2018 Dec 15. J Virol. 2018. PMID: 30282715 Free PMC article.
-
Differential Diagnosis for Highly Pathogenic Avian Influenza Virus Using Nanoparticles Expressing Chemiluminescence.Viruses. 2021 Jun 30;13(7):1274. doi: 10.3390/v13071274. Viruses. 2021. PMID: 34208793 Free PMC article.
-
Receptor Binding-Induced Conformational Changes in Herpes Simplex Virus Glycoprotein D Permit Interaction with the gH/gL Complex to Activate Fusion.Viruses. 2023 Mar 30;15(4):895. doi: 10.3390/v15040895. Viruses. 2023. PMID: 37112875 Free PMC article.
References
-
- Spear PG, Eisenberg RJ, Cohen GH. 2000. Three classes of cell surface receptors for alphaherpesvirus entry. Virology 275:1–8 - PubMed
-
- Heldwein EE, Lou H, Bender FC, Cohen GH, Eisenberg RJ, Harrison SC. 2006. Crystal structure of glycoprotein B from herpes simplex virus 1. Science 313:217–220 - PubMed
-
- Kadlec J, Loureiro S, Abrescia NG, Stuart DI, Jones IM. 2008. The postfusion structure of baculovirus gp64 supports a unified view of viral fusion machines. Nat. Struct. Mol. Biol. 15:1024–1030 - PubMed
Publication types
MeSH terms
Substances
Grants and funding
LinkOut - more resources
Full Text Sources
Other Literature Sources
Miscellaneous

