

Assessment of protein disorder region predictions in CASP10
- PMID: 23946100
- PMCID: PMC4406047
- DOI: 10.1002/prot.24391
Assessment of protein disorder region predictions in CASP10
Abstract
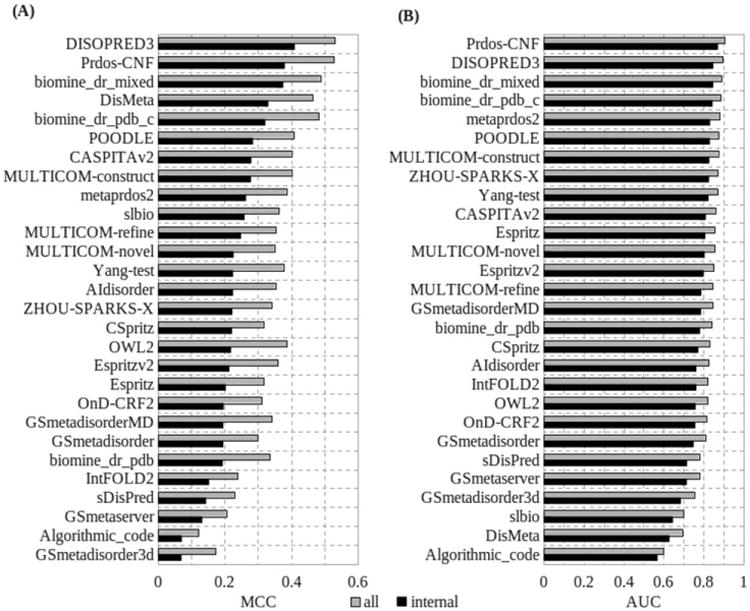
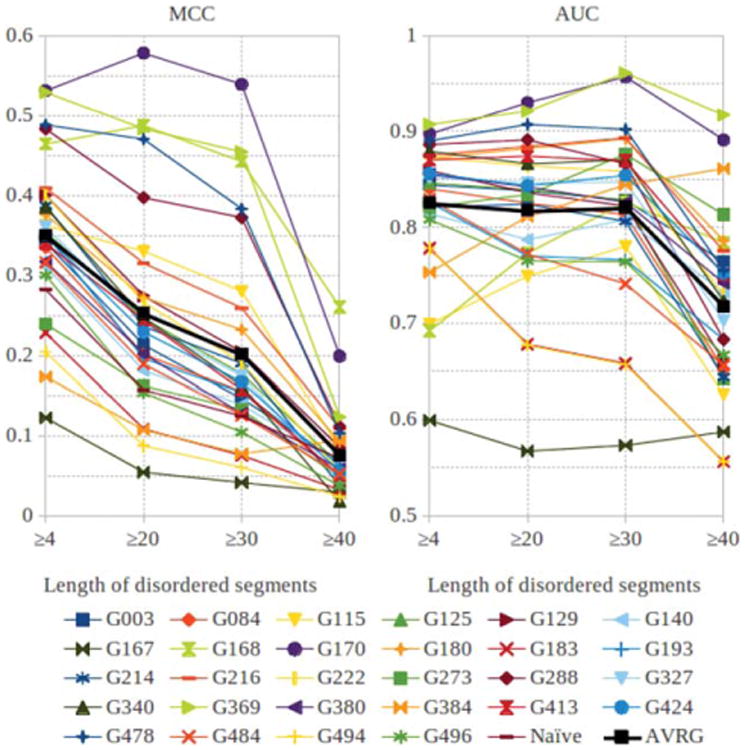
The article presents the assessment of disorder region predictions submitted to CASP10. The evaluation is based on the three measures tested in previous CASPs: (i) balanced accuracy, (ii) the Matthews correlation coefficient for the binary predictions, and (iii) the area under the curve in the receiver operating characteristic (ROC) analysis of predictions using probability annotation. We also performed new analyses such as comparison of the submitted predictions with those obtained with a Naïve disorder prediction method and with predictions from the disorder prediction databases D2P2 and MobiDB. On average, the methods participating in CASP10 demonstrated slightly better performance than those in CASP9.
Keywords: CASP; assessment of disorder prediction; intrinsically disordered proteins; prediction of disordered regions; unstructured proteins.
Copyright © 2013 Wiley Periodicals, Inc.
Figures

Similar articles
-
Evaluation of disorder predictions in CASP9.Proteins. 2011;79 Suppl 10(S10):107-18. doi: 10.1002/prot.23161. Epub 2011 Sep 16. Proteins. 2011. PMID: 21928402 Free PMC article.
-
Evaluation of residue-residue contact prediction in CASP10.Proteins. 2014 Feb;82 Suppl 2(0 2):138-53. doi: 10.1002/prot.24340. Epub 2013 Aug 31. Proteins. 2014. PMID: 23760879 Free PMC article.
-
Exploring Protein Intrinsic Disorder with MobiDB.Methods Mol Biol. 2020;2141:127-143. doi: 10.1007/978-1-0716-0524-0_6. Methods Mol Biol. 2020. PMID: 32696355
-
A comprehensive review and comparison of existing computational methods for intrinsically disordered protein and region prediction.Brief Bioinform. 2019 Jan 18;20(1):330-346. doi: 10.1093/bib/bbx126. Brief Bioinform. 2019. PMID: 30657889 Review.
-
Accuracy of protein-level disorder predictions.Brief Bioinform. 2020 Sep 25;21(5):1509-1522. doi: 10.1093/bib/bbz100. Brief Bioinform. 2020. PMID: 31616935 Review.
Cited by
-
Prediction of intrinsically disordered regions in proteins using signal processing methods: application to heat-shock proteins.Med Biol Eng Comput. 2016 Dec;54(12):1831-1844. doi: 10.1007/s11517-016-1477-x. Epub 2016 Apr 1. Med Biol Eng Comput. 2016. PMID: 27037818
-
Classification of intrinsically disordered regions and proteins.Chem Rev. 2014 Jul 9;114(13):6589-631. doi: 10.1021/cr400525m. Epub 2014 Apr 29. Chem Rev. 2014. PMID: 24773235 Free PMC article. Review. No abstract available.
-
DisPredict: A Predictor of Disordered Protein Using Optimized RBF Kernel.PLoS One. 2015 Oct 30;10(10):e0141551. doi: 10.1371/journal.pone.0141551. eCollection 2015. PLoS One. 2015. PMID: 26517719 Free PMC article.
-
Novel linear motif filtering protocol reveals the role of the LC8 dynein light chain in the Hippo pathway.PLoS Comput Biol. 2017 Dec 14;13(12):e1005885. doi: 10.1371/journal.pcbi.1005885. eCollection 2017 Dec. PLoS Comput Biol. 2017. PMID: 29240760 Free PMC article.
-
Functional Analysis of Human Hub Proteins and Their Interactors Involved in the Intrinsic Disorder-Enriched Interactions.Int J Mol Sci. 2017 Dec 19;18(12):2761. doi: 10.3390/ijms18122761. Int J Mol Sci. 2017. PMID: 29257115 Free PMC article.
References
-
- Romero P, Obradovic Z, Kissinger C, Villafranca JE, Dunker AK. Identifying disorder regions in proteins from amino acid sequence. Proc IEEE Int Conf Neural Netw. 1997;1:90–95.
-
- Wright PE, Dyson HJ. Intrinsically unstructured proteins: reassessing the protein structure-function paradigm. J Mol Biol. 1999;293:321–331. - PubMed
-
- Dunker AK, Obradovic Z, Romero P, Garner EC, Brown CJ. Intrinsic protein disorder in complete genomes. Genome Inform Ser Workshop Genome Inform. 2000;11:161–171. - PubMed
-
- Tompa P. Intrinsically unstructured proteins. Trends Biochem Sci. 2002;27:527–533. - PubMed
Publication types
MeSH terms
Substances
Grants and funding
LinkOut - more resources
Full Text Sources
Other Literature Sources
Miscellaneous
