. 2014 Apr;71(8):1477-504.
doi: 10.1007/s00018-013-1446-6. Epub 2013 Aug 13.

A creature with a hundred waggly tails: intrinsically disordered proteins in the ribosome

Affiliations

A creature with a hundred waggly tails: intrinsically disordered proteins in the ribosome

Zhenling Peng et al. Cell Mol Life Sci. 2014 Apr.

Abstract

Intrinsic disorder (i.e., lack of a unique 3-D structure) is a common phenomenon, and many biologically active proteins are disordered as a whole, or contain long disordered regions. These intrinsically disordered proteins/regions constitute a significant part of all proteomes, and their functional repertoire is complementary to functions of ordered proteins. In fact, intrinsic disorder represents an important driving force for many specific functions. An illustrative example of such disorder-centric functional class is RNA-binding proteins. In this study, we present the results of comprehensive bioinformatics analyses of the abundance and roles of intrinsic disorder in 3,411 ribosomal proteins from 32 species. We show that many ribosomal proteins are intrinsically disordered or hybrid proteins that contain ordered and disordered domains. Predicted globular domains of many ribosomal proteins contain noticeable regions of intrinsic disorder. We also show that disorder in ribosomal proteins has different characteristics compared to other proteins that interact with RNA and DNA including overall abundance, evolutionary conservation, and involvement in protein-protein interactions. Furthermore, intrinsic disorder is not only abundant in the ribosomal proteins, but we demonstrate that it is absolutely necessary for their various functions.


Figures
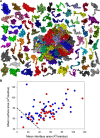
Fig. 1
Fig. 1
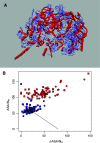
a Computational disassembly of the eukaryotic ribosome from the yeast Saccharomyces cerevisiae (PDB ID: 3U5C and 3U5E; [57]). Structure of the proteinaceous component of the ribosome is shown at the center of the plot as a large complex, and structures of the individual ribosomal proteins are positioned around this central complex. The figure clearly shows that there are almost no ribosomal proteins with simple globular shape, and many of them contain long protrusions or extensions. b Plot of per-residue surface versus per-residue interface areas. Surface and interface area normalized by the number of residues in each chain for the ribosomal proteins were estimated as described in [60]. Proteins of the 40S and 60S subunits are shown by red and blue circles, respectively. A boundary separating ordered and disordered complexes is shown as a black dashed line
Fig. 2
Fig. 2
Foldability of globular and extended domains of ribosomal proteins from the yeast Saccharomyces cerevisiae. a Worm representation of 60S proteins. Color and width of ribbon corresponds to the OC posterior probability, where regions with a high probability are red and wide and regions with a low probability are blue and thin. b Nussinov’s plot of ΔASA against the ASA for the IC (blue) and OC (red) residues of 40S (circles) and 50S (squares) proteins
Fig. 3
Fig. 3
Contact order values for proteins from the eukaryotic ribosome (PDB IDs: 3U5C and 3U5E). The figure includes three distributions of the contact order values: for all chains combined (black line), for 3U5C (green line), and for 3U5E (red line). The chains’ identifiers from these proteins that have contact order values in a given interval are listed above the x-axis. Illustrative examples of structures of the ribosomal proteins with low contact order [chains e, f, and h in the crystal structure of the 40S subunit (PDB ID: 5U3C), and chains R and b in the crystal structure of the 60S subunit (PDB ID: 3E5E)] and the ribosomal proteins with relatively high contact order [chains U and c in the crystal structure of the 40S subunit (PDB ID: 5U3C), and chains c, d, f, and o in the crystal structure of the 60S subunit (PDB ID: 3E5E)] are shown on the sides of the plot
Fig. 4
Fig. 4
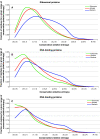
Fractional difference in the amino acid composition between the different members of the family of ribosomal proteins from Bacteria (green bars), Archaea (red bars), and Eukaryota (yellow bars) and a set of completely ordered proteins calculated for each amino acid residue (compositional profiles). The fractional differences were evaluated for the full-length ribosomal proteins (a) and for extended (b) and globular domains (c). The fractional difference was calculated as (C x − C order)/C order, where C x is the content of a given amino acid in a query set, and C order is the corresponding content in the dataset of fully ordered proteins. Composition profile of typical intrinsically disordered proteins from the DisProt database is shown for comparison (black bars). Positive bars correspond to residues found more abundantly in ribosomal proteins, whereas negative bars show residues, in which ribosomal proteins are depleted. Amino acid types were ranked according to their increasing disorder-promoting potential [15]. Panel d shows enrichment of amino acid M in the functions assumed by disordered regions that are considered in this work. We considered 26 functions from Table S2 that were annotated using DisProt database (as explained in the “Materials and methods” section); to assure statistically sound results 13 functions that have at least 20 annotated segments are shown. The fractional difference was calculated for M for the 13 functions that are sorted alphabetically on the x-axis. Positive bars correspond to function (disordered segments annotated with a given function) found with high counts of M while negative bars show functions where M is depleted. Panels e and f compare the amino acid compositions of the ribosomal, RNA- and DNA-binding proteins. In e, the fractional difference was calculated as (C x − C order)/C order, where C x is the content of a given amino acid in a query set, and C order is the corresponding content in the dataset of fully ordered proteins. In f, the compositions of the RNA- and DNA-binding proteins are compared with the general amino acid composition of the ribosomal proteins. Here, the normalized compositions of the RNA- and DNA-binding proteins are evaluated in the (C s − C ribosomal)/C ribosomal form, with C s being a content of a given residue in a dataset of the RNA- or DNA-binding proteins), and C ribosomal being the corresponding value for ribosomal proteins. In both plots, composition profiles of typical intrinsically disordered proteins from the DisProt database are shown for comparison (black bars)
Fig. 5
Fig. 5
Disorder content (crosses and lines) and fraction of fully disordered proteins (black bars) in different species and domains of life for the ribosomal, DNA-, and RNA-binding proteins. The species, which are shown on the x-axis, are grouped into the Eukaryota, Archaea, and Bacteria domains
Fig. 6
Fig. 6
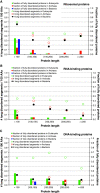
The number of long disordered segments (30 or more residues) per protein (y-axis on the left; hollow points) and the fraction of fully disordered protein (y-axis on the right; solid bars) against protein length (x-axis) across the three domains of life in ribosomal (a), RNA- (b), and DNA-binding proteins (c)
Fig. 7
Fig. 7
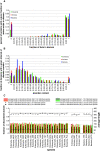
Characterization of the globular domains in ribosomal proteins. Globular domains were predicted using the GlobPlot server (http://globplot.embl.de/). a The distribution of fraction of amino acids in domain per protein. b The distribution of disorder content per domain. c The fraction of disordered domains (hollow and solid circles, respectively; y-axis on the left) and the average length of disordered (red and orange bars) and ordered domains (dark and bright green bars; y-axis on the right). Domains were assumed to be disordered when they contain at least one disordered region with at least four consecutive disordered residues (def_1) or when at least half of their residues are disordered (def_2)
Fig. 8
Fig. 8
a Evaluation of the abundance of intrinsic disorder in ribosomal proteins from the three domains of life, Bacteria (green circles), Archaea (red circles), and Eukaryota (yellow circles), in the form of a CH–CDF plot [74, 75]. b CH–CDF plot for archaeal ribosomal proteins that are split on globular (dark red) and non-globular domains (red). c CH–CDF plot for bacterial ribosomal proteins that are split on globular (dark green) and non-globular domains (green). d CH–CDF plot for eukaryotic ribosomal proteins that are split on globular (dark yellow) and non-globular domains (yellow)
Fig. 9
Fig. 9
Distribution of the length of the disordered segments across the three domains of life of ribosomal proteins (a) and the corresponding cumulative distribution (b). Length distributions of corresponding ribosomal proteins (c) with its cumulative distribution (d)
Fig. 10
Fig. 10
Fraction of short (4–30 amino acids) and long (over 30 amino acids) disordered segments for a given function; x-axis represents the 13 considered functions sorted by the decreasing number of short segments
Fig. 11
Fig. 11
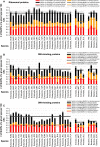
Number of MoRFs per protein, shown using stacked bars, across different species and domains. The bars are subdivided using colors that correspond to different MoRF types. The solid lines show a cumulative (over MoRF types located below the line) average number of a given MoRF type for each of the three domains. The species, which are shown on the x-axis, are grouped into Eukaryota, Archaea, and Bacteria domains. Plots a, b, and c correspond to ribosomal, and RNA- and DNA-binding proteins, respectively
Fig. 12
Fig. 12
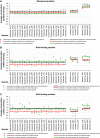
Distribution of the average relative entropy, which quantifies evolutionary conservation, for the proteins from Eukaryota, Archaea, and Bacteria. Plots a, b, and c correspond to ribosomal, and RNA- and DNA-binding proteins, respectively
Fig. 13
Fig. 13
The average relative entropy that quantifies evolutionary conservation across different species and domains. Blue points/lines, green triangles/lines, and orange crosses/lines denote the average relative entropy of disordered residues in long disordered segments, all disordered residues, and ordered residues, respectively. The species, which are shown on the x-axis, are grouped into Eukaryota, Archaea, and Bacteria domains. Plots a, b, and c correspond to ribosomal, RNA- and DNA-binding proteins, respectively
Fig. 14
Fig. 14
Comparison of disorder content between orthologous (green bars) and non-orthologous (red bars) proteins across all pairs of the selected species from the three kingdoms of life, including H. sapiens (HOMO), E. coli (ECO), and S. tokodaii (SUL). The hollow bars denote the overall, for a given species, disorder content. The numbers above the bars indicate the corresponding count of orthologous and non-orthologous chains

Similar articles

Cited by

References

    1. Dunker AK, Obradovic Z, Romero P, Garner EC, Brown CJ. Intrinsic protein disorder in complete genomes. Genome Inf Ser Workshop Genome Inf. 2000;11:161–171. - PubMed
    1. Uversky VN, Dunker AK. Understanding protein non-folding. Biochim Biophys Acta. 2010;1804(6):1231–1264. - PMC - PubMed
    1. Ward JJ, Sodhi JS, McGuffin LJ, Buxton BF, Jones DT. Prediction and functional analysis of native disorder in proteins from the three kingdoms of life. J Mol Biol. 2004;337(3):635–645. - PubMed
    1. Uversky VN, Gillespie JR, Fink AL. Why are “natively unfolded” proteins unstructured under physiologic conditions? Proteins. 2000;41(3):415–427. - PubMed
    1. Xue B, Dunker AK, Uversky VN. Orderly order in protein intrinsic disorder distribution: disorder in 3500 proteomes from viruses and the three domains of life. J Biomol Struct Dyn. 2012;30(2):137–149. - PubMed

Publication types

MeSH terms

LinkOut - more resources