. 2013 Jul 23;8(7):e69347.
doi: 10.1371/journal.pone.0069347. Print 2013.

A role for MeCP2 in switching gene activity via chromatin unfolding and HP1γ displacement

Affiliations

A role for MeCP2 in switching gene activity via chromatin unfolding and HP1γ displacement

Maartje C Brink et al. PLoS One. .

Abstract

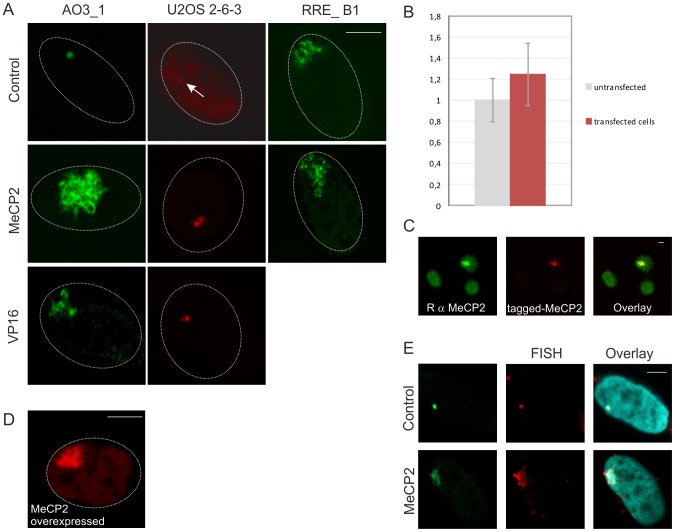
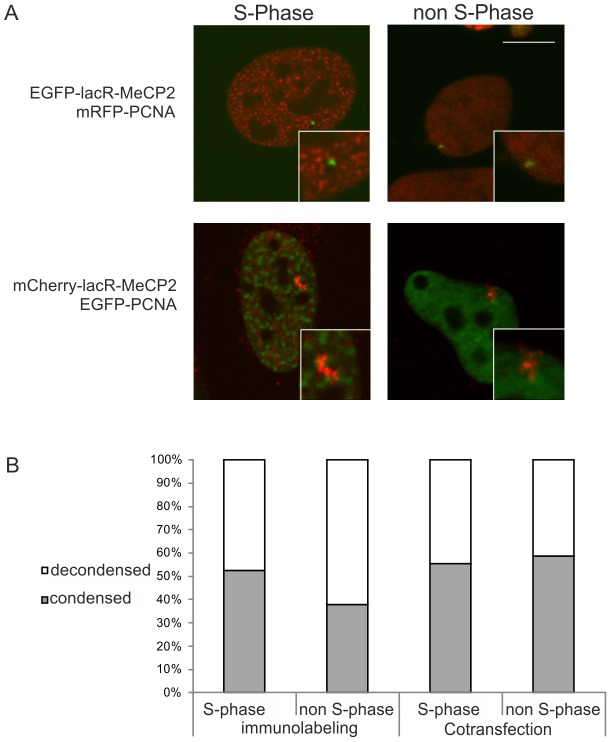
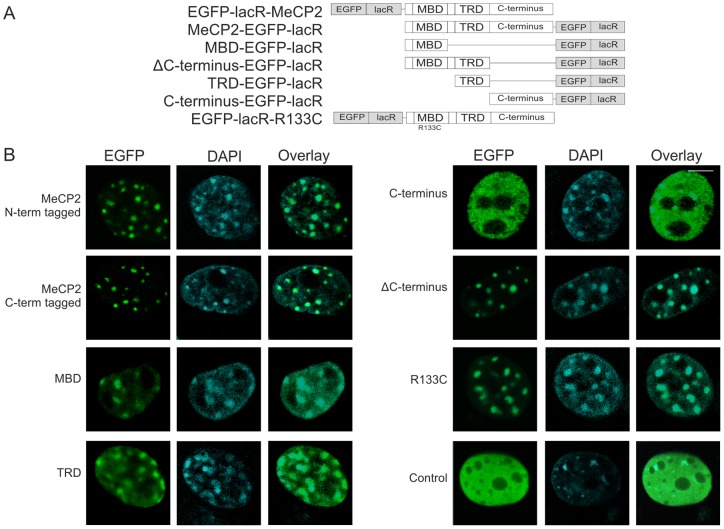
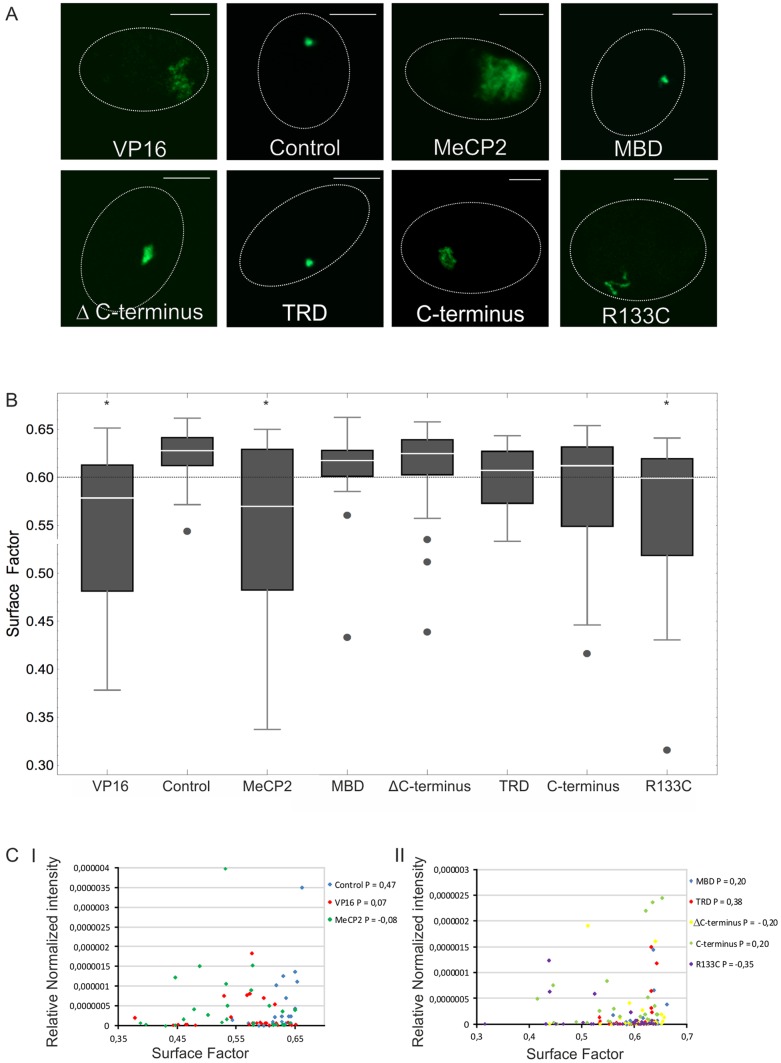
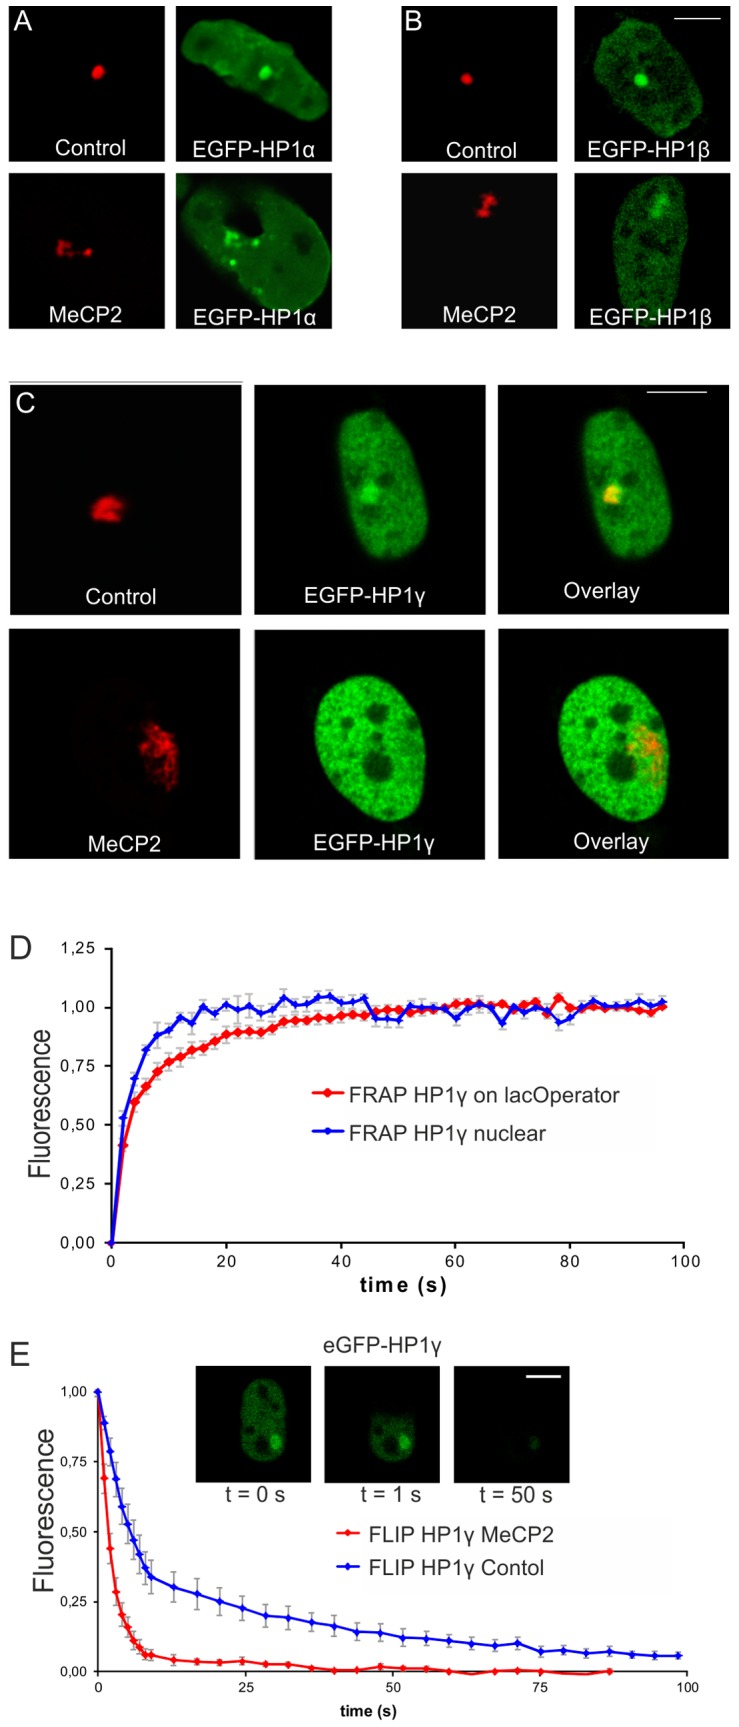
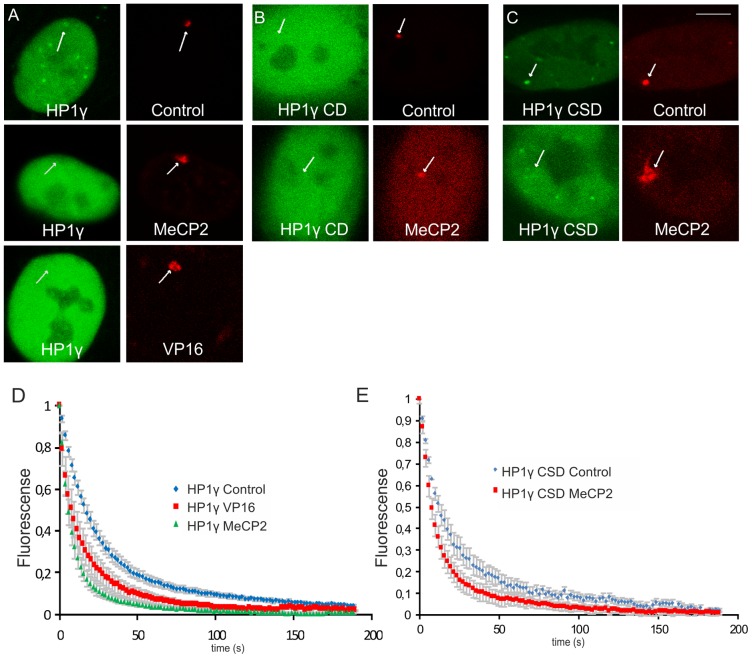
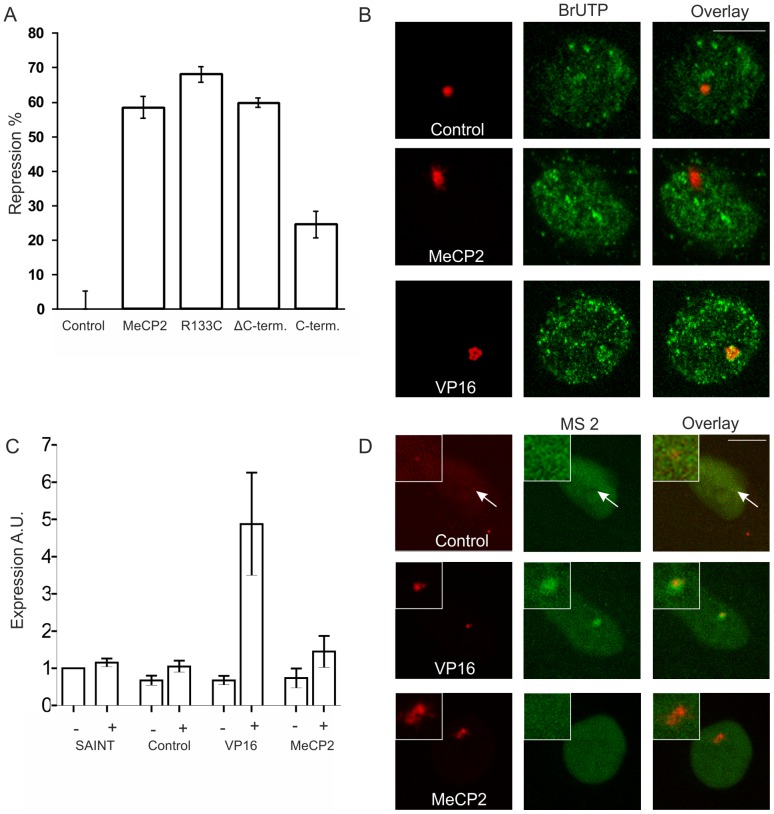
Methyl-CpG-binding protein 2 (MeCP2) is generally considered to act as a transcriptional repressor, whereas recent studies suggest that MeCP2 is also involved in transcription activation. To gain insight into this dual function of MeCP2, we assessed the impact of MeCP2 on higher-order chromatin structure in living cells using mammalian cell systems harbouring a lactose operator and reporter gene-containing chromosomal domain to assess the effect of lactose repressor-tagged MeCP2 (and separate MeCP2 domains) binding in living cells. Our data reveal that targeted binding of MeCP2 elicits extensive chromatin unfolding. MeCP2-induced chromatin unfolding is triggered independently of the methyl-cytosine-binding domain. Interestingly, MeCP2 binding triggers the loss of HP1γ at the chromosomal domain and an increased HP1γ mobility, which is not observed for HP1α and HP1β. Surprisingly, MeCP2-induced chromatin unfolding is not associated with transcriptional activation. Our study suggests a novel role for MeCP2 in reorganizing chromatin to facilitate a switch in gene activity.


Conflict of interest statement

Competing Interests: The authors have declared that no competing interest exist.

Figures

Figure 1
Figure 1. MeCP2 unfolds chromatin.
The effect of MeCP2 lacR-lacO targeting on 3D chromatin folding was measured in AO3_1 and RRE_B1 clones (CHO derived, containing an amplified chromosomal region consisting of DHFR cDNA transgene, 256 lac operator repeats and flanking DNA) and the 2-6-3 clone (U2OS derived, containing lacO repeats and a tetracycline inducible reporter gene encoding cyano fluorescent protein and 24 repeats of the MS2 bacteriophage translational operator). The images show a typical representation of cells 48 hours after transfection. We imaged at least 100 cells per transfection and for quantitative measurents approximately 30 cells per transfection were imaged under comparable microscopical set-up (see Figure 4). (A) The images show individual optical sections of AO3_1 cells transfected with EGFP-lacR (control), EGFP-lacR-tagged MeCP2 or VP16, 2-6-3 cells transfected with EGFP-lacR (control), mCherry-lacR tagged MeCP2 or VP16 and RRE_B1 cells transfected with EGFP-lacR (control) or EGFP-lacR-tagged MeCP2. (B) AO3_1 cells expressing mCherry-lacR-tagged MeCP2 (n = 138) (shown in C) contain ∼25% more MeCP2 levels then endogenous MeCP2 (in non-transfected cells, n = 249). The error bars show the standard deviation of the analyzed cells (C) The images (a thick slice taken with open pinhole setting) to quantify endogenous/exogenous MeCP2 levels (shown in B), show AO3_1 cells transfected with mCherry-lacR tagged MeCP2 and immunolabeled with an antibody against MeCP2. (D) The images show an individual optical section of an AO3_1 cell highly over-expressing tagged MeCP2 (5,3 times higher than representative cells shown in (A). Representative cells are the cells that allow the Argos image analysis programme to select the lacO array from nuclear background, i.e. the cells on which we performed our quantitative measurements (see Figure 4 and S1). This analysis of MeCP2 over-expression illustrates that in cells exhibiting overexpressed MeCP2 levels a visually unfolded lacO chromatin array is observed similar as in the cells expressing representative MeCP2 levels. (E) The images show AO3_1 cells transfected with EGFP-lacR (control) and EGFP-lacR tagged MeCP2 (green signal), FISH-labeled with a fluorescent lacO probe (red signal) and DAPI-stained (blue signal). The images represent individual optical sections. Bars  = 5 μm.
Figure 2
Figure 2. MeCP2-induced chromatin unfolding is independent of cell-cycle stage.
(A) The images show 2-6-3 cells (U2OS derived clone containing a 200 copy chromosomal array of 256 lacO repeats and a reporter gene harboring 24 repeats of the MS2 bacteriophage) that were co-transfected with mCherry-tagged (red signal) or EGFP-tagged (green signal) lacR-MeCP2 and EGFP-tagged (green signal) or mRFP-tagged (red signal) PCNA. PCNA localizes at replication foci during S phase. The images represent individual optical sections of fixed cells. Bar  = 5 μm. (B) The histogram shows quantification of the number of lacR-MeCP2 transfected cells showing a condensed (grey bar) or decondensed (white bar) chromosomal array in either S or non-S phase based on PCNA expression or immunolabeling (on X-axis noted as immunolabeling, n = 74 and cotransfection, n = 68). A χ2 test was performed on PCNA immunolabeled (p = 0.25) and cotransfected cells (p = 0.81). Random variation probabilities show a high random variation between the decondensation and the cell cycle phase.
Figure 3
Figure 3. Nuclear distribution of EGFP-lacR-tagged MeCP2 domains in mouse fibroblasts.
(A) The illustration shows a schematic representation of the tested constructs: EGFP-lacR tagged (grey boxes) full-length MeCP2, C- and N- terminally-tagged, separate MeCP2 domains (MBD, ΔC-terminus, TRD, C-terminus) and R133C Rett syndrome mutation (white boxes). (B) The images show EGFP-lacR-tagged MeCP2 and separate MeCP2 domains (green signal) that were expressed for 48 hours in NIH/3T3 cells and stained with DAPI (blue signal). MeCP2 and separate MeCP2 domains localize at DAPI dense chromocenters, except for the ΔC-terminus. We imaged approximately 100 cells per condition. The images represent individual optical sections of DAPI stained cells. Bar  = 5 μm.
Figure 4
Figure 4. MeCP2-induced chromatin unfolding acts independently of the methyl-cytosine-binding domain.
(A) The images show AO3_1 cells (CHO-derived clone containing an amplified chromosomal region consisting of the DHFR cDNA transgene and 256 lac operator repeats) that were transfected (green signal) with EGFP-lacR (control) or EGFP-lacR-tagged full-length MeCP2, -VP16 and -MeCP2 separate domains (i.e. MBD, ΔC-terminus, TRD, C-terminus and R133C Rett syndrome mutation). The images show a typical representation of cells transfected for 48 hours. For quantitative analysis 30 nuclei per condition were measured with comparable microscopical set-up. The images represent examples of individual optical sections. Bar  = 5 μm. (B) The figure shows the changes in lacO array large-scale chromatin structure measured with a 3D image analysis parameter, i.e. the surface factor. The surface factor determines the surface of a given chromosomal domain/object normalized to the surface of a sphere with an equal volume . The distribution of the surface factor measurements is plotted as a box-plot. The second and third quartiles of the observed values are within the box, the median value is shown by the white horizontal line, the whiskers show the first and fourth quartiles of the observed values, dots are the outliers. The dotted line represents the ∼20% of cells in the EGFP-lacR control population that exhibit a mildly decondensed array (see also [69]). Considering a population (20%) of control cells exhibiting a decondensed configuration as the threshold of MeCP2-induced decondensation, the following percentages are found for lacR control 18%, VP16 68%, MeCP2 full length 47%, MBD 23%, ΔC-terminus 23%, C-terminus 47% and R133C 50%). We scored the chromatin structure based on the surface factor in the full cell population. Based on our statistical analysis the EGFP-lacR tagged VP16, MeCP2 (full length) and the R133C population are significantly different from EGFP-lacR control, whereas EGFP-lacR tagged MBD, TRD, C-terminus and ΔC-terminus, are not significantly different from EGFP-lacR (for p values see Table 1). (C) The figure shows the intensity of the transfected constructs measured within the lacO chromsomal array and plotted versus the chromatin surface factor measurements of the respective cells (I: Control, VP16 and MeCP2, II: MBD, TRD, C-terminus, ΔC-terminus and R133C). The Pearson correlation coefficient (Ρ) of the intensity of the transfected constructs and the determined surface factors are given.
Figure 5
Figure 5. MeCP2 interferes with HP1γ binding.
AO3_1 cells (CHO-derived clone containing an integrated lacO array) were co-transfected with EGFP-tagged HP1α, β or γ (green signal) and mCherry-tagged lacR or lacR-MeCP2 (red signal). (A-C) Pictures show 3D images that were recorded of living cells. The images represent individual optical sections and nuclei have the same scale. Bar  = 5 μm. (D) The curves show Fluorescent Recovery After Photobleaching (FRAP) data of HP1γ at the lac operator (red curve) as well as at the overall nuclear localization (blue curve) (E) The graphs show FLIP curves of EGFP-HP1γ in the presence of mCherry-lacR-MeCP2 (red line) or mCherry-lacR (blue line). The insets show an EGFP-HP1γ and mCherry-lacR targeted cell of which half of the nucleus is continuously bleached (only green channel is shown). Bar  = 5 μm. FLIP was measured in the bottom half of the nucleus.
Figure 6
Figure 6. Interference with the binding of HP1γ and separate HP1γ domains.
2-6-3 clone (U2OS-derived clone containing a 200 copy chromosomal array of 256 lacO repeats and a reporter gene harboring 24 repeats of the MS2 bacteriophage) were co-transfected with YFP-tagged HP1γ, HP1γ CD (1–75) or HP1γ CSD (92–173) (green signal) and mCherry-tagged lacR, lacR-MeCP2 or lacR-VP16 (red signal). (A–C) Pictures show 3D images that were recorded of living cells (A–C). The images represent individual optical sections and nuclei have the same scale. Bar  = 5 μm. (D) The graphs show FLIP (Fluorescent loss after photobleaching) curves of YFP-HP1γ in the presence of mCherry-lacR (control, blue line), mCherry-lacR-MeCP2 (green line) or mCherry-lacR-VP16 (red line). (E) The graphs show FLIP curves of YFP-HP1γ CSD in the presence of mCherry-lacR (control, blue line) or mCherry-lacR-MeCP2 (red line).
Figure 7
Figure 7. Reporter gene activity upon MeCP2-induced chromatin unfolding.
(A) The histogram shows luciferase activity that was measured 48h after transfecting U2OS cells with β-Gal plasmid, an 8x lacO luciferase construct and the plasmids EGFP-lacR (control) and EGFP-lacR-tagged full length MeCP2 and separate MeCP2 domains (i.e. R133C Rett syndrome mutation, C-terminus and ΔC-terminus). Values are the mean ± standard error of 3 independent measurements. (B) AO3_1 cells (CHO-derived clone containing an amplified chromosomal region consisting of the DHFR cDNA transgene and 256 lac operator repeats) were transfected with mCherry-lacR, mCherry-lacR-MeCP2 or mCherry-lacR-VP16 (red signal) and nascent RNA was labeled by incorporation of BrUTP in permeabilized cells (green signal). Bar  = 5 μm. (C) The histogram shows DHFR transcriptional activity of AO3_1 cells that were transfected with EGFP-lacR (control), EGFP-lacR-MeCP2 or EGFP-lacR-VP16. Cells were sorted with the FACS and RT-qPCR was performed on both the EGFP-positive (+) as well as on the negative (−) cell population. Data was normalized to non-transfected samples and a transfection control was included (SAINT mix), which were both not FACS sorted. (D) The images show the 2-6-3 clone (U2OS-derived clone containing a 200 copy chromosomal array of 256 lacO repeats and a reporter gene harboring 24 repeats of the MS2 bacteriophage) that was transfected with MS2-YFP to visualize transcribed RNA (green signal) together with mCherry-LacR-tagged MeCP2 or VP16 (red signal detecting the lacO array). The images represent individual optical sections and nuclei are on the same scale. Bar  = 5 μm.

Similar articles

Cited by

References

    1. van Steensel B (2011) Chromatin: constructing the big picture. EMBO J 30: 1885–1895. - PMC - PubMed
    1. Fuks F, Hurd PJ, Wolf D, Nan X, Bird AP, et al. (2003) The methyl-CpG-binding protein MeCP2 links DNA methylation to histone methylation. J Biol Chem 278: 4035–4040. - PubMed
    1. Agarwal N, Hardt T, Brero A, Nowak D, Rothbauer U, et al. (2007) MeCP2 interacts with HP1 and modulates its heterochromatin association during myogenic differentiation. Nucleic Acids Res 35: 5402–5408. - PMC - PubMed
    1. Shahbazian MD, Antalffy B, Armstrong DL, Zoghbi HY (2002) Insight into Rett syndrome: MeCP2 levels display tissue- and cell-specific differences and correlate with neuronal maturation. Hum Mol Genet 11: 115–124. - PubMed
    1. Skene PJ, Illingworth RS, Webb S, Kerr AR, James KD, et al. (2010) Neuronal MeCP2 is expressed at near histone-octamer levels and globally alters the chromatin state. Mol Cell 37: 457–468. - PMC - PubMed

Publication types

Grants and funding

Support was provided by the Netherlands Organization for Scientific Research VIDI-016041311, NWO-Meervoud-83607001 to PJV, VIDI-91786373 to MGR and Deutsche Forschungsgemeinschaft to MCC. The funders had no role in the study design, data collection and analysis, decision to publish, or preparation of the manuscript.

LinkOut - more resources