. 2013;9(8):e1003571.
doi: 10.1371/journal.pgen.1003571. Epub 2013 Aug 1.

Computational identification of diverse mechanisms underlying transcription factor-DNA occupancy

Affiliations

Computational identification of diverse mechanisms underlying transcription factor-DNA occupancy

Qiong Cheng et al. PLoS Genet. 2013.

Abstract

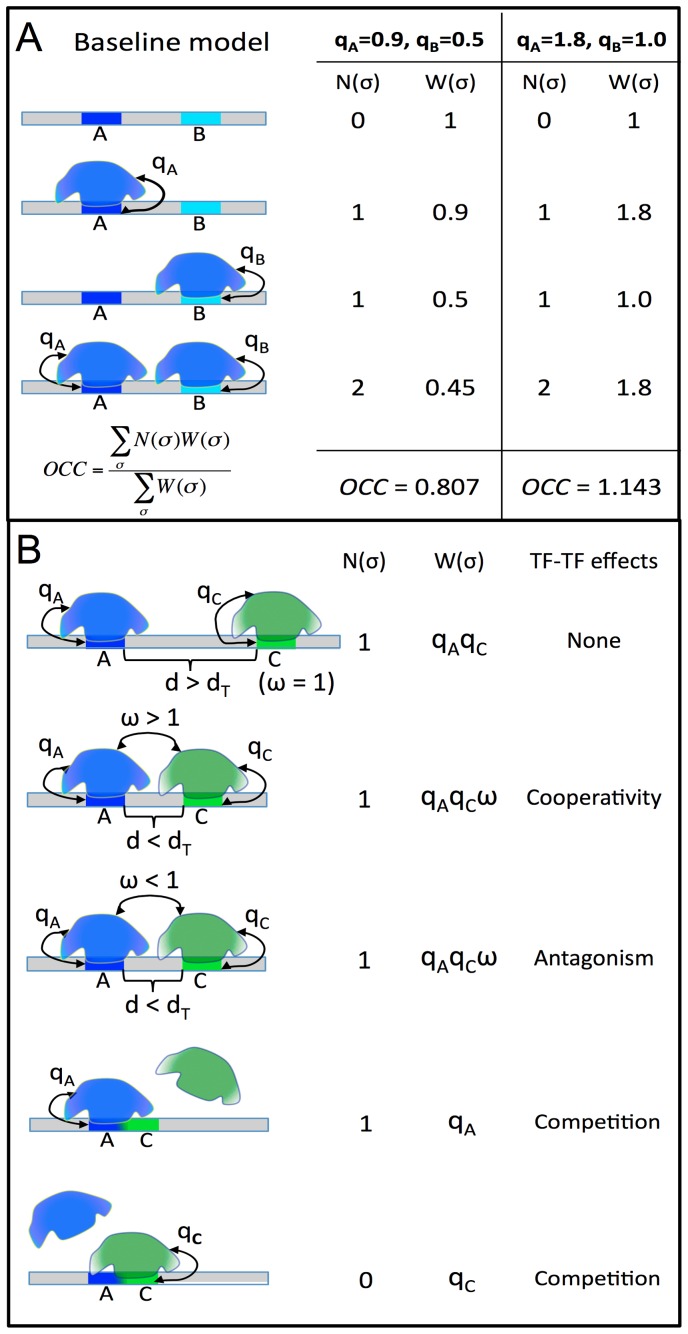
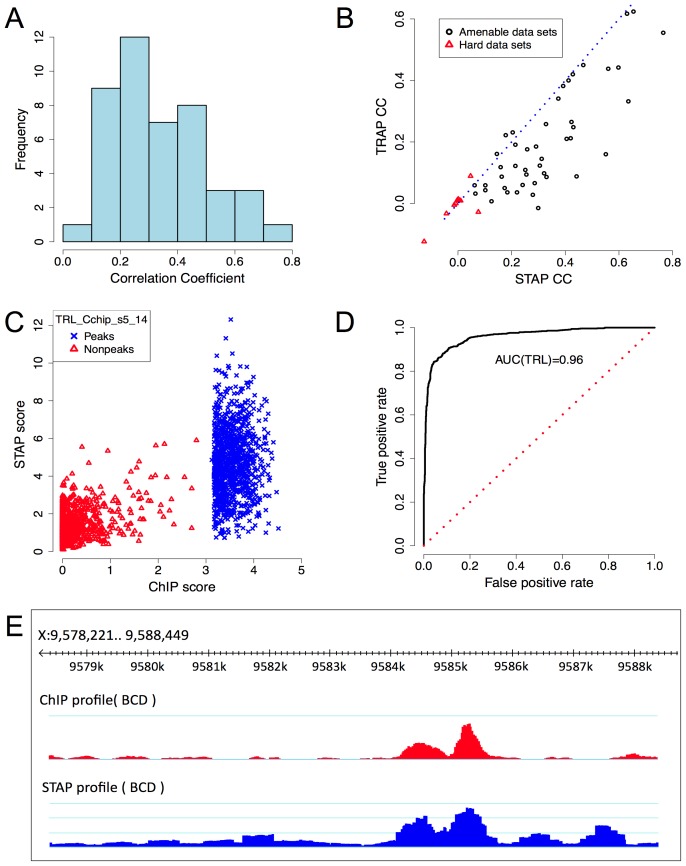
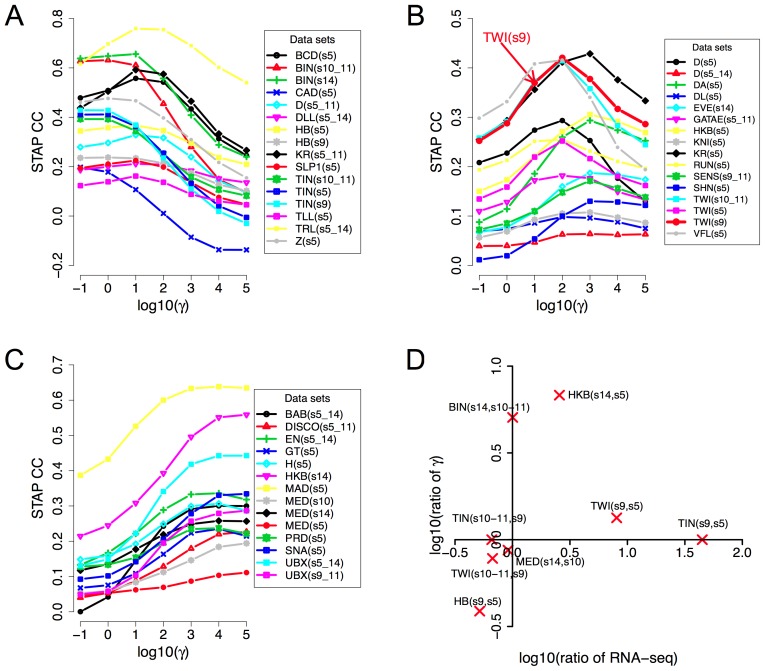
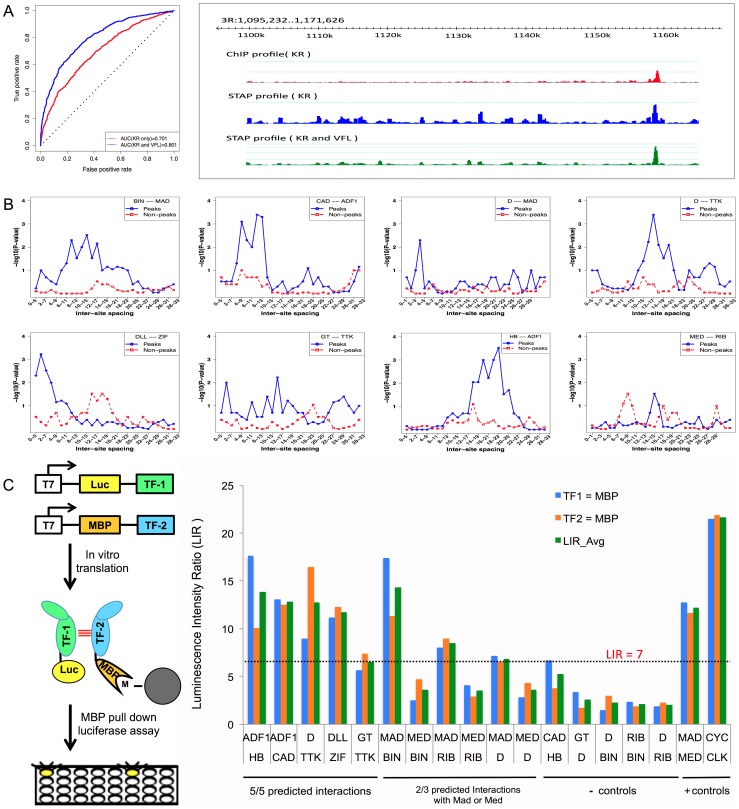
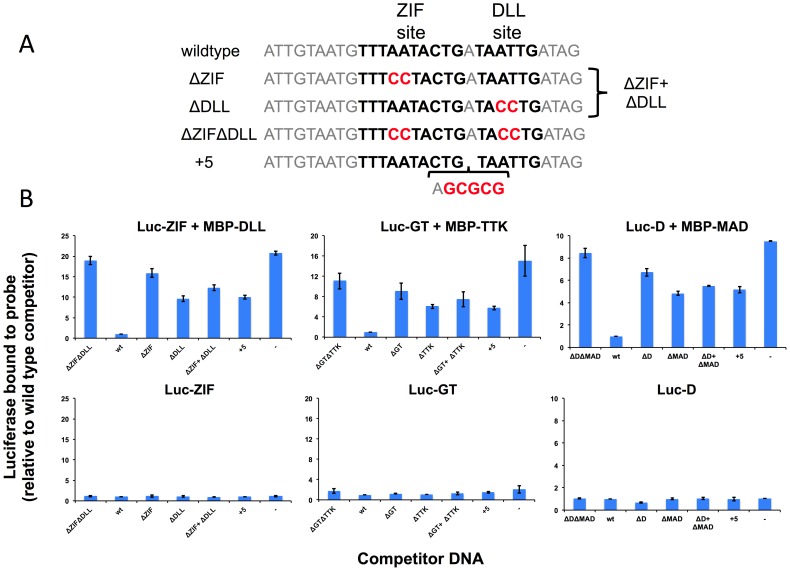
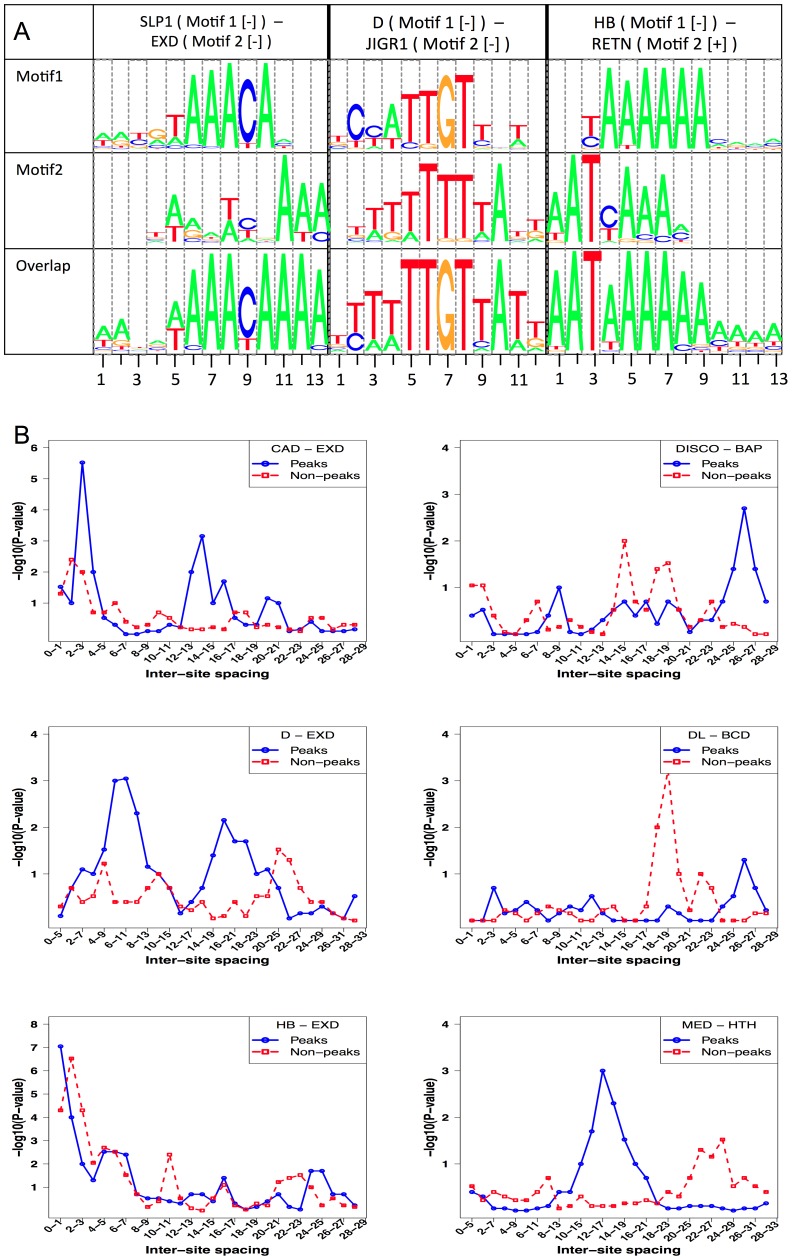
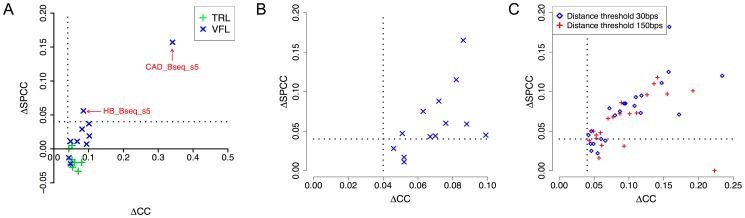
ChIP-based genome-wide assays of transcription factor (TF) occupancy have emerged as a powerful, high-throughput method to understand transcriptional regulation, especially on a global scale. This has led to great interest in the underlying biochemical mechanisms that direct TF-DNA binding, with the ultimate goal of computationally predicting a TF's occupancy profile in any cellular condition. In this study, we examined the influence of various potential determinants of TF-DNA binding on a much larger scale than previously undertaken. We used a thermodynamics-based model of TF-DNA binding, called "STAP," to analyze 45 TF-ChIP data sets from Drosophila embryonic development. We built a cross-validation framework that compares a baseline model, based on the ChIP'ed ("primary") TF's motif, to more complex models where binding by secondary TFs is hypothesized to influence the primary TF's occupancy. Candidates interacting TFs were chosen based on RNA-SEQ expression data from the time point of the ChIP experiment. We found widespread evidence of both cooperative and antagonistic effects by secondary TFs, and explicitly quantified these effects. We were able to identify multiple classes of interactions, including (1) long-range interactions between primary and secondary motifs (separated by ≤150 bp), suggestive of indirect effects such as chromatin remodeling, (2) short-range interactions with specific inter-site spacing biases, suggestive of direct physical interactions, and (3) overlapping binding sites suggesting competitive binding. Furthermore, by factoring out the previously reported strong correlation between TF occupancy and DNA accessibility, we were able to categorize the effects into those that are likely to be mediated by the secondary TF's effect on local accessibility and those that utilize accessibility-independent mechanisms. Finally, we conducted in vitro pull-down assays to test model-based predictions of short-range cooperative interactions, and found that seven of the eight TF pairs tested physically interact and that some of these interactions mediate cooperative binding to DNA.


Conflict of interest statement

The authors have declared that no competing interests exist.

Figures

Figure 1
Figure 1. STAP model of TF-DNA binding.
A. Baseline model: only the ChIP'ed (“primary”) TF is considered, and its putative sites in the given sequence are identified. Here, A is a strong site and B is a medium strength site of the TF. Four possible configurations (σ) of A and/or B bound by the TF are enumerated, and for each σ the relative weight W(σ) is calculated as the product of terms (qA, qB) specific to sites occupied in that configuration. The occupancy is then estimated as a weighted average of N(σ), the number of occupied sites in σ. The site-specific terms qA, qB are proportional to TF concentration, so a doubling of concentration will change (qA = 0.9, qB = 0.5) to (qA = 1.8, qB = 1.0), and this will impact the predicted occupancy (OCC = 0.807 to OCC = 1.143), but does not double the prediction, due to saturation effects. B. Interaction between the primary TF (blue) and a secondary TF (green) is modeled by re-defining the relative weight of a configuration where both sites are bound. If the two sites are separated by more than some distance threshold dT, nothing changes, and there is no interaction. If the separation is less than dT, the relative weight of σ is multiplied by an interaction term ω, which can be >1 (for cooperative influence) or <1 (for antagonistic influence). This increases or decreases (respectively) the probability of the joint configuration, and therefore the overall occupancy of the primary TF at site A. Competitive binding at overlapping sites A, C is modeled automatically, since both sites may not be occupied simultaneously in any configuration.
Figure 2
Figure 2. Baseline model performance.
A. Histogram of CC values from Table 1. B. Comparison of CC from STAP-based motif scores to those from TRAP-based motif scores, on all 55 data sets that were examined. Red triangular symbols represent the ten data sets that showed poor CC in all of our models and were thus excluded from reported results. C. ChIP scores and STAP scores for all 2000 segments in the data set that had the best CC overall: “TRL_Cchip_s5_14”. Blue and red points represent the 1000 top ChIP peaks and 1000 randomly selected non-coding segments respectively. D. Receiver Operating Characteristic (ROC) curve for a classifier that uses a threshold on the STAP score to discriminate TF-bound segments from non-bound segments, defined by the top 50% and bottom 50% ChIP scores in the data set “TRL_Cchip_s5_14”. The area under this curve (AUC) is 0.960. E. ChIP (red) and STAP (blue) predicted ChIP score profiles for the transcription factor BCD on a ∼10 Kbp region near gene BTD, at the developmental stage 5. The Pearson's CC at this locus is 0.80.
Figure 3
Figure 3. Influence of TF concentration to TF-DNA occupancy.
A–C: Dependence of correlation coefficient (CC) between ChIP scores and STAP scores (y-axis) on the TF-specific parameter γ that was varied in the range 10−1 and 105 (x-axis). All 45 data sets are shown, split into three panels corresponding to cases where the optimal γ was in the range 10−1 to 101 (A), 102 to 103 (B), or 104 to 105 (C). The parameter γ in the STAP model reflects the product of the equilibrium constant of the consensus site and the TF's concentration. D. Changes in the trained value of the TF-specific parameter γ from one stage to another are consistent with changes in RNA-SEQ-based expression level of the TF. Given a TF for which we have ChIP data from two different developmental stages, the ratio of the trained γ values reflects the ratio of TF concentration in those two stages, as per the model. This ratio is plotted against the ratio of RNA-SEQ levels of the TF's gene from those two developmental stages. All points are in the first or third quadrants suggesting that the trained γ values are consistent with expression data. Each point is labeled by the profiled TF's name and the two corresponding developmental stages.
Figure 4
Figure 4. Influence of TF-TF cooperative interactions on TF-DNA occupancy.
A. ROC curve and Genome Surveyor tracks of the single motif model and best TF-TF interaction model for the data set “KR_Bseq_s5”, where CC(KR) = 0.487, CC(KR+VFL) = 0.774, AUC(KR) = 0.701, and AUC(KR+VFL) = 0.801. B. Inter-site spacing bias for a selection of putative TF-TF cooperative interactions. The statistical significance of inter-site spacing bias in the top 250 ChIP peaks (blue) or 250 non-peaks (red) of a data set is measured by the Fisher's Exact Test, for different spacing ranges (x-axis). TF pairs are named in legend (inset) with primary TF appearing first. C. Experimental validation of predicted direct TF-TF interactions. (Left) Candidate interacting TF pairs were produced by in vitro transcription/translation of renilla luciferase (Luc) and maltose binding protein (MBP) tagged proteins; luciferase activity co-isolated with the MBP-tagged protein was determined. (Right) For each heteromeric pair, interaction was tested in two configurations, with either TF1 or TF2 tagged with MBP. Results for each configuration alone and the average of both experiments are shown. A Luminescence Intensity Ratio (LIR) cutoff of 7 was used for positive interactions. Error bars indicate the Standard Deviation.
Figure 5
Figure 5. Experimental validation of predicted cooperative DNA binding by three TF pairs, ZIF with DLL, GT with TTK and D with MAD.
Relative recovery of luciferase-tagged TF with a biotinylated target DNA sequence is measured in the presence of one or both TFs and various unlabeled competitor sequences. (A) Examples of wild type and mutant competitor sequences are shown for the analysis of ZIF with DLL. The sequences for all competitor sequences are shown in Table S16. The wild type sequence has a strong predicted TF binding sites, shown in bold type, for the luc-tagged TF (ZIF, GT, D) and for the hypothesized interacting TF (DLL, TTK, MAD respectively). As controls, competitor sequences are used where either one (ΔZIF or ΔDLL) or both (ΔZIFΔDLL) TF binding sites are disrupted or the spacing between sites has been increased by 5 bp (+5). An additional competition experiment uses two competitor DNAs (ΔZIF + ΔDLL), each of which is at the same concentration as the single competitor DNAs in the other samples. Altered or inserted nucleotides are shown in red. Genomic sequences flanking the binding sites are in grey. (B) The luciferase activity recovered bound to the biotinylated wild type probe was measured in the presence of different competitors listed on the X-axis. A dash is used to indicate no added competitor DNA. Luciferase measurements are reported relative to a sample using the wild type sequence as a competitor (Y-axis). In the upper panels, recovery of the luciferase-tagged protein is measured in the presence of the hypothesized interacting TF present as an MBP tagged protein. In the presence of the secondary TF, wild type sequences compete better for binding than sequences in which the sequence of or spacing between predicted binding sites is disrupted. In the lower panels, recovery is shown in the absence of the second protein. For all three primary TFs, little activity is recovered in the absence of the secondary TF, regardless of the competitor DNA.
Figure 6
Figure 6. Competitive bindings and antagonistic bindings: another mechanisms deciding TF-DNA occupancy.
A. Overlapping sites for (primary motif, secondary motif) pairs where modeling competitive binding leads to significantly better prediction of ChIP scores. Shown here is the pattern of overlap between sites of SLP1 and EXD, D and JIGR1 and between HB and RETN. In each case, the sequences examined were those with high STAP score for the primary motif but low ChIP score. In each panel, the top two motif logos correspond to the primary and secondary TF respectively and the bottom logo represents the overlapping sites. B. Inter-site spacing bias analysis for six TF pairs that show significant evidence of antagonistic binding. TF pairs are named in legend (inset) with primary TF appearing first.
Figure 7
Figure 7. DNA accessibility data provides clues about mechanisms of secondary TF action.
A. Correlation coefficient between ChIP scores and STAP predictions, before and after “partialing out” the effect of accessibility scores (ΔCC and ΔSPCC respectively). Shown here are the effects of VFL and TRL motifs, in cooperative binding mode. Only cases where ΔCC was significant are shown. Dotted lines mark a ΔCC (or ΔSPCC) value of 0.04. B. All cases of significant cooperative influence of secondary motifs other than VFL, TRL, examined before (ΔCC) and after (ΔSPCC) “partialing out” the effect of accessibility scores. Only cases where ΔCC was significant and the secondary TF gene was in the top 10–15% of expressed genes are shown. C. All cases of antagonistic influence by secondary motifs, examined before and after “partialing out” the effect of accessibility scores.

Similar articles

Cited by

References

    1. Roy S, Ernst J, Kharchenko PV, Kheradpour P, Negre N, et al. (2010) Identification of functional elements and regulatory circuits by Drosophila modENCODE. Science 330: 1787–1797. - PMC - PubMed
    1. Myers RM, Stamatoyannopoulos J, Snyder M, Dunham I, Hardison RC, et al. (2011) A user's guide to the encyclopedia of DNA elements (ENCODE). PLoS Biol 9: e1001046. - PMC - PubMed
    1. Yip KY, Cheng C, Bhardwaj N, Brown JB, Leng J, et al. (2012) Classification of human genomic regions based on experimentally determined binding sites of more than 100 transcription-related factors. Genome Biol 13: R48. - PMC - PubMed
    1. Gerstein MB, Kundaje A, Hariharan M, Landt SG, Yan KK, et al. (2012) Architecture of the human regulatory network derived from ENCODE data. Nature 489: 91–100. - PMC - PubMed
    1. Yanez-Cuna JO, Dinh HQ, Kvon EZ, Shlyueva D, Stark A (2012) Uncovering cis-regulatory sequence requirements for context-specific transcription factor binding. Genome Res 22: 2018–2030. - PMC - PubMed

Publication types

LinkOut - more resources