Autophagy sequesters damaged lysosomes to control lysosomal biogenesis and kidney injury
- PMID: 23921551
- PMCID: PMC3770333
- DOI: 10.1038/emboj.2013.171
Autophagy sequesters damaged lysosomes to control lysosomal biogenesis and kidney injury
Abstract
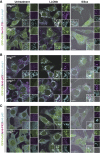
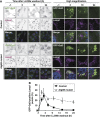
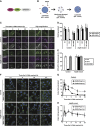
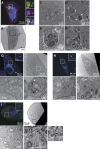
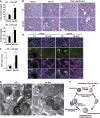
Diverse causes, including pathogenic invasion or the uptake of mineral crystals such as silica and monosodium urate (MSU), threaten cells with lysosomal rupture, which can lead to oxidative stress, inflammation, and apoptosis or necrosis. Here, we demonstrate that lysosomes are selectively sequestered by autophagy, when damaged by MSU, silica, or the lysosomotropic reagent L-Leucyl-L-leucine methyl ester (LLOMe). Autophagic machinery is recruited only on damaged lysosomes, which are then engulfed by autophagosomes. In an autophagy-dependent manner, low pH and degradation capacity of damaged lysosomes are recovered. Under conditions of lysosomal damage, loss of autophagy causes inhibition of lysosomal biogenesis in vitro and deterioration of acute kidney injury in vivo. Thus, we propose that sequestration of damaged lysosomes by autophagy is indispensable for cellular and tissue homeostasis.
Conflict of interest statement
The authors declare that they have no conflict of interest.
Figures
Similar articles
-
Transgenic expression of a ratiometric autophagy probe specifically in neurons enables the interrogation of brain autophagy in vivo.Autophagy. 2019 Mar;15(3):543-557. doi: 10.1080/15548627.2018.1528812. Epub 2018 Oct 26. Autophagy. 2019. PMID: 30269645 Free PMC article.
-
Trehalose induces autophagy via lysosomal-mediated TFEB activation in models of motoneuron degeneration.Autophagy. 2019 Apr;15(4):631-651. doi: 10.1080/15548627.2018.1535292. Epub 2018 Nov 5. Autophagy. 2019. PMID: 30335591 Free PMC article.
-
ATG7 deficiency suppresses apoptosis and cell death induced by lysosomal photodamage.Autophagy. 2012 Sep;8(9):1333-41. doi: 10.4161/auto.20792. Epub 2012 Aug 14. Autophagy. 2012. PMID: 22889762 Free PMC article.
-
Structural aspects of autophagy.Adv Exp Med Biol. 1996;389:103-11. doi: 10.1007/978-1-4613-0335-0_12. Adv Exp Med Biol. 1996. PMID: 8860999 Review.
-
Aging: central role for autophagy and the lysosomal degradative system.Ageing Res Rev. 2009 Jul;8(3):199-213. doi: 10.1016/j.arr.2009.05.001. Epub 2009 May 7. Ageing Res Rev. 2009. PMID: 19427410 Review.
Cited by
-
Sensitive detection of lysosomal membrane permeabilization by lysosomal galectin puncta assay.Autophagy. 2015;11(8):1408-24. doi: 10.1080/15548627.2015.1063871. Autophagy. 2015. PMID: 26114578 Free PMC article.
-
Autophagy in kidney homeostasis and disease.Nat Rev Nephrol. 2020 Sep;16(9):489-508. doi: 10.1038/s41581-020-0309-2. Epub 2020 Jul 23. Nat Rev Nephrol. 2020. PMID: 32704047 Free PMC article. Review.
-
The endoplasmic reticulum contributes to lysosomal tubulation/sorting driven by LRRK2.Mol Biol Cell. 2022 Nov 1;33(13):ar124. doi: 10.1091/mbc.E22-04-0139. Epub 2022 Aug 31. Mol Biol Cell. 2022. PMID: 36044336 Free PMC article.
-
Fbxo2 mediates clearance of damaged lysosomes and modifies neurodegeneration in the Niemann-Pick C brain.JCI Insight. 2020 Oct 15;5(20):e136676. doi: 10.1172/jci.insight.136676. JCI Insight. 2020. PMID: 32931479 Free PMC article.
-
Nanomaterials for Autophagy-Related miRNA-34a Delivery in Cancer Treatment.Front Pharmacol. 2020 Jul 24;11:1141. doi: 10.3389/fphar.2020.01141. eCollection 2020. Front Pharmacol. 2020. PMID: 32792960 Free PMC article. Review.
References
-
- Boya P, Kroemer G (2008) Lysosomal membrane permeabilization in cell death. Oncogene 27: 6434–6451 - PubMed
-
- Dupont N, Lacas-Gervais S, Bertout J, Paz I, Freche B, Van Nhieu GT, van der Goot FG, Sansonetti PJ, Lafont F (2009) Shigella phagocytic vacuolar membrane remnants participate in the cellular response to pathogen invasion and are regulated by autophagy. Cell Host Microbe 6: 137–149 - PubMed
-
- Ejaz AA, Mu W, Kang D-H, Roncal C, Sautin YY, Henderson G, Tabah-Fisch I, Keller B, Beaver TM, Nakagawa T, Johnson RJ (2006) Could uric acid have a role in acute renal failure? Clin J Am Soc Nephrol 2: 16–21 - PubMed
Publication types
MeSH terms
Substances
LinkOut - more resources
Full Text Sources
Other Literature Sources
Molecular Biology Databases
Research Materials

