

A comparative phenotypic and genomic analysis of C57BL/6J and C57BL/6N mouse strains
- PMID: 23902802
- PMCID: PMC4053787
- DOI: 10.1186/gb-2013-14-7-r82
A comparative phenotypic and genomic analysis of C57BL/6J and C57BL/6N mouse strains
Abstract
Background: The mouse inbred line C57BL/6J is widely used in mouse genetics and its genome has been incorporated into many genetic reference populations. More recently large initiatives such as the International Knockout Mouse Consortium (IKMC) are using the C57BL/6N mouse strain to generate null alleles for all mouse genes. Hence both strains are now widely used in mouse genetics studies. Here we perform a comprehensive genomic and phenotypic analysis of the two strains to identify differences that may influence their underlying genetic mechanisms.
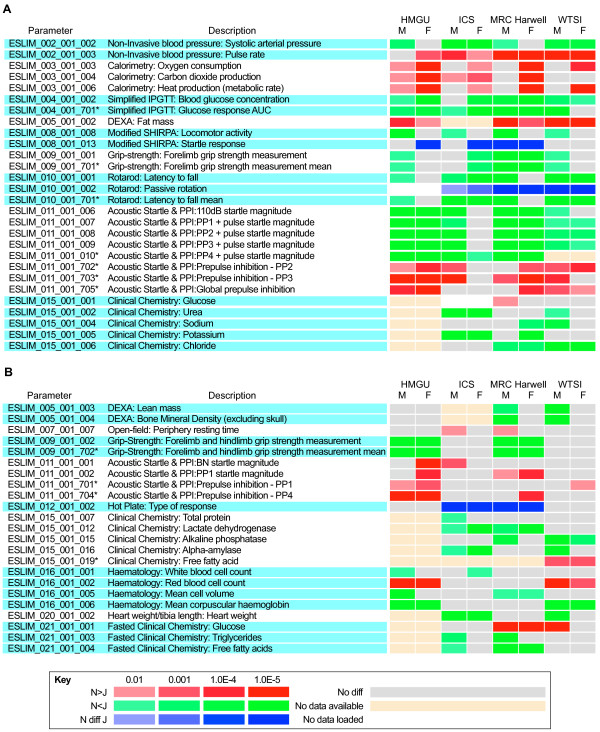
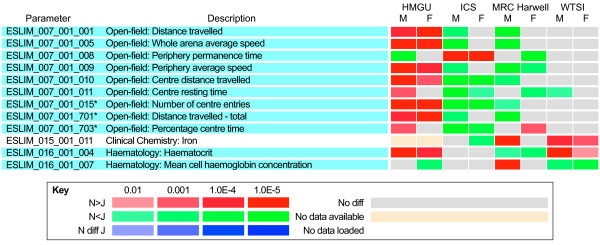
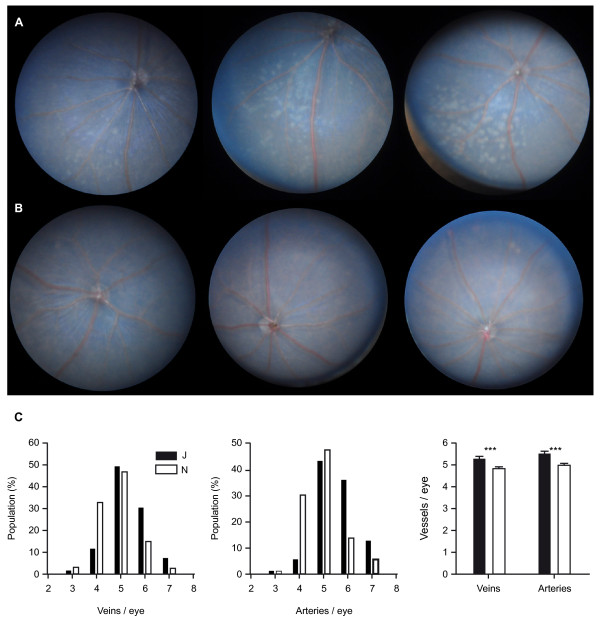
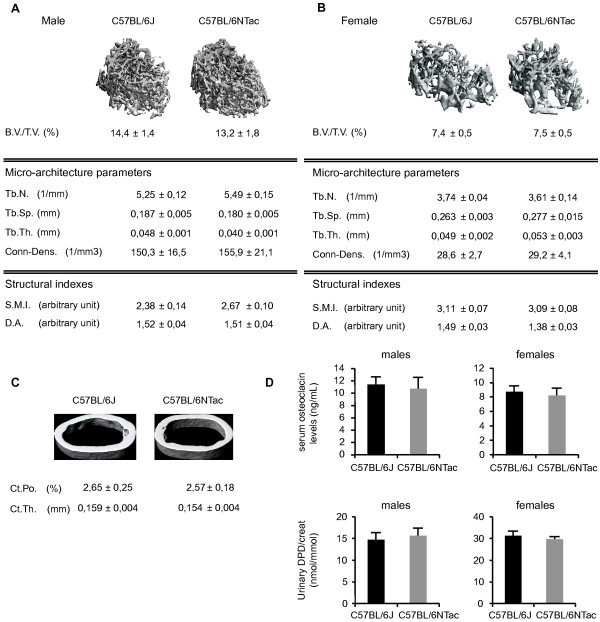
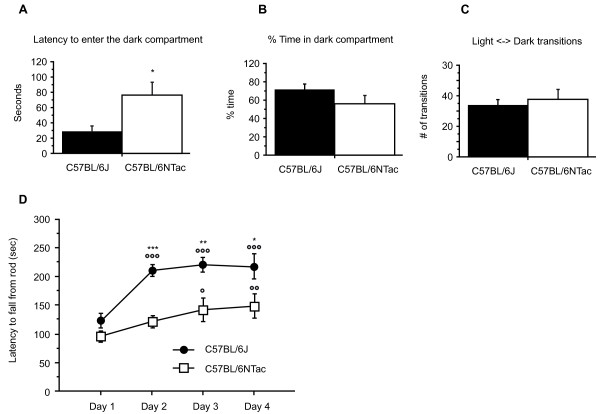
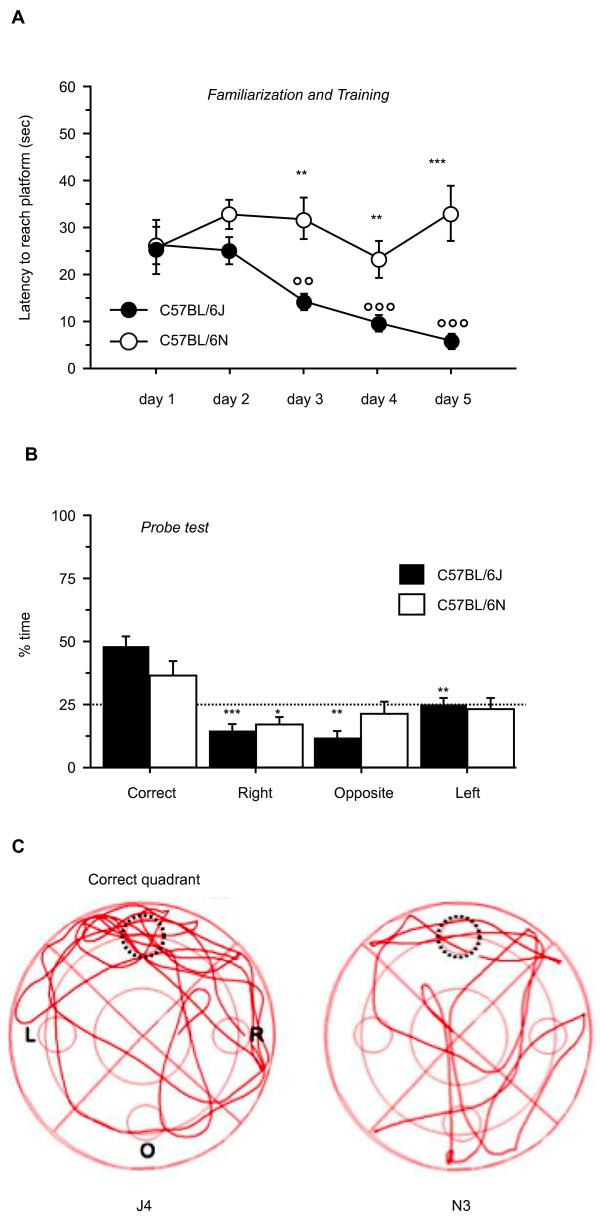
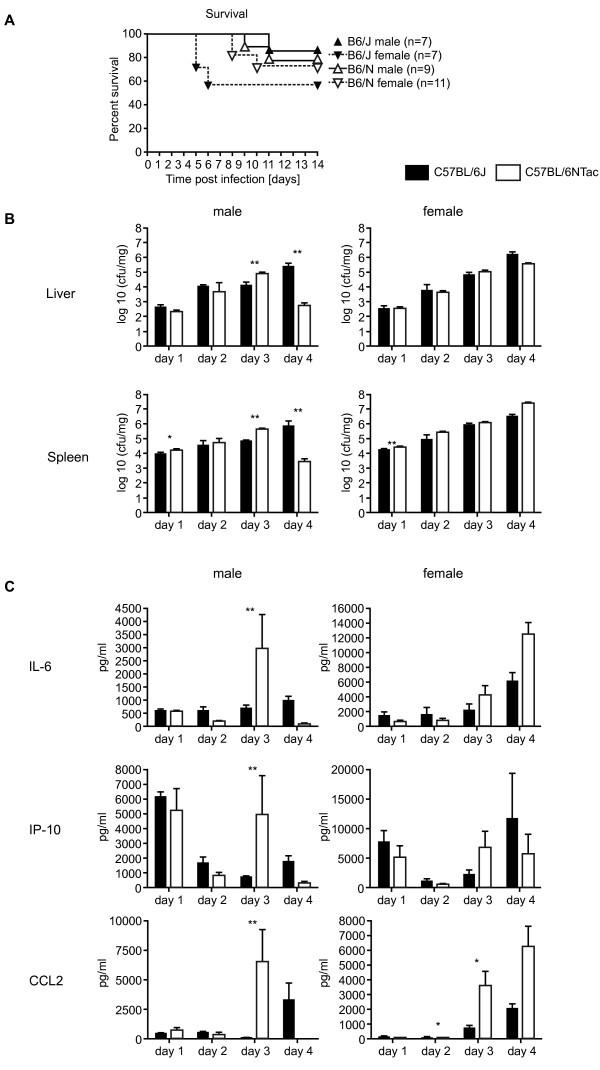
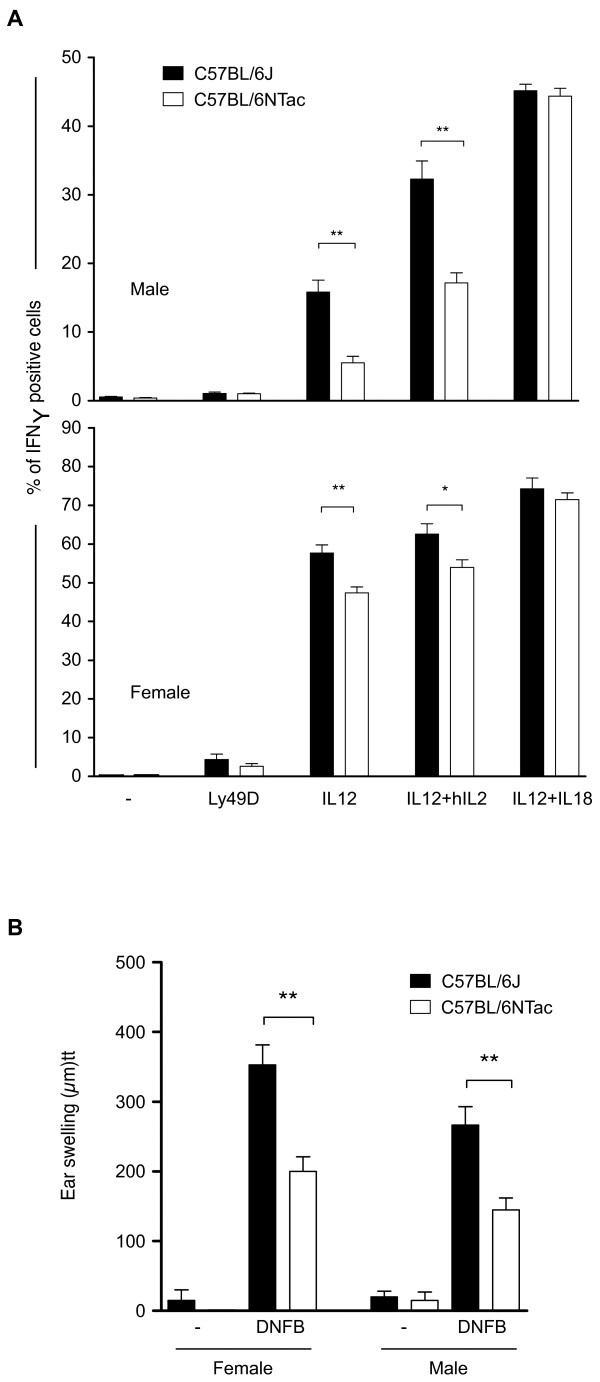
Results: We undertake genome sequence comparisons of C57BL/6J and C57BL/6N to identify SNPs, indels and structural variants, with a focus on identifying all coding variants. We annotate 34 SNPs and 2 indels that distinguish C57BL/6J and C57BL/6N coding sequences, as well as 15 structural variants that overlap a gene. In parallel we assess the comparative phenotypes of the two inbred lines utilizing the EMPReSSslim phenotyping pipeline, a broad based assessment encompassing diverse biological systems. We perform additional secondary phenotyping assessments to explore other phenotype domains and to elaborate phenotype differences identified in the primary assessment. We uncover significant phenotypic differences between the two lines, replicated across multiple centers, in a number of physiological, biochemical and behavioral systems.
Conclusions: Comparison of C57BL/6J and C57BL/6N demonstrates a range of phenotypic differences that have the potential to impact upon penetrance and expressivity of mutational effects in these strains. Moreover, the sequence variants we identify provide a set of candidate genes for the phenotypic differences observed between the two strains.
Figures
Similar articles
-
Development of SNP markers for C57BL/6N-derived mouse inbred strains.Exp Anim. 2015;64(1):91-100. doi: 10.1538/expanim.14-0061. Epub 2014 Oct 23. Exp Anim. 2015. PMID: 25341966 Free PMC article.
-
Deep genome sequencing and variation analysis of 13 inbred mouse strains defines candidate phenotypic alleles, private variation and homozygous truncating mutations.Genome Biol. 2016 Aug 1;17(1):167. doi: 10.1186/s13059-016-1024-y. Genome Biol. 2016. PMID: 27480531 Free PMC article.
-
The Rd8 mutation of the Crb1 gene is present in vendor lines of C57BL/6N mice and embryonic stem cells, and confounds ocular induced mutant phenotypes.Invest Ophthalmol Vis Sci. 2012 May 17;53(6):2921-7. doi: 10.1167/iovs.12-9662. Print 2012. Invest Ophthalmol Vis Sci. 2012. PMID: 22447858 Free PMC article.
-
Attention to Background Strain Is Essential for Metabolic Research: C57BL/6 and the International Knockout Mouse Consortium.Diabetes. 2016 Jan;65(1):25-33. doi: 10.2337/db15-0982. Diabetes. 2016. PMID: 26696638 Free PMC article. Review.
-
Substrains matter in phenotyping of C57BL/6 mice.Exp Anim. 2021 May 13;70(2):145-160. doi: 10.1538/expanim.20-0158. Epub 2021 Jan 14. Exp Anim. 2021. PMID: 33441510 Free PMC article. Review.
Cited by
-
A Direct Comparison of Metabolic Responses to High-Fat Diet in C57BL/6J and C57BL/6NJ Mice.Diabetes. 2016 Nov;65(11):3249-3261. doi: 10.2337/db16-0291. Epub 2016 Aug 5. Diabetes. 2016. PMID: 27495226 Free PMC article.
-
High-fat diet induces obesity in adult mice but fails to develop pre-penile and penile vascular dysfunction.Int J Impot Res. 2022 Apr;34(3):308-316. doi: 10.1038/s41443-021-00440-9. Epub 2021 May 4. Int J Impot Res. 2022. PMID: 33947973 Free PMC article.
-
How do stochastic processes and genetic threshold effects explain incomplete penetrance and inform causal disease mechanisms?Philos Trans R Soc Lond B Biol Sci. 2024 Apr 22;379(1900):20230045. doi: 10.1098/rstb.2023.0045. Epub 2024 Mar 4. Philos Trans R Soc Lond B Biol Sci. 2024. PMID: 38432317 Free PMC article. Review.
-
Impact of the Endocannabinoid System on Bone Formation and Remodeling in p62 KO Mice.Front Pharmacol. 2022 Mar 22;13:858215. doi: 10.3389/fphar.2022.858215. eCollection 2022. Front Pharmacol. 2022. PMID: 35392569 Free PMC article.
-
ProMetIS, deep phenotyping of mouse models by combined proteomics and metabolomics analysis.Sci Data. 2021 Dec 3;8(1):311. doi: 10.1038/s41597-021-01095-3. Sci Data. 2021. PMID: 34862403 Free PMC article.
References
-
- Skarnes WC, Rosen B, West AP, Koutsourakis M, Bushell W, Iyer V, Mujica AO, Thomas M, Harrow J, Cox T, Jackson D, Severin J, Biggs P, Fu J, Nefedov M, de Jong PJ, Stewart AF, Bradley A. A conditional knockout resource for the genome-wide study of mouse gene function. Nature. 2011;14:337–342. doi: 10.1038/nature10163. - DOI - PMC - PubMed
-
- Carneiro AM, Airey DC, Thompson B, Zhu CB, Lu L, Chesler EJ, Erikson KM, Blakely RD. Functional coding variation in recombinant inbred mouse lines reveals multiple serotonin transporter-associated phenotypes. Proc Natl Acad Sci USA. 2009;14:2047–2052. doi: 10.1073/pnas.0809449106. - DOI - PMC - PubMed
Publication types
MeSH terms
Grants and funding
- MC_U142684175/MRC_/Medical Research Council/United Kingdom
- MC_QA137918/MRC_/Medical Research Council/United Kingdom
- G0800024/MRC_/Medical Research Council/United Kingdom
- MC_UP_1502/1/MRC_/Medical Research Council/United Kingdom
- MC_U142684171/MRC_/Medical Research Council/United Kingdom
- MC_U142684172/MRC_/Medical Research Council/United Kingdom
- MC_U127561112/MRC_/Medical Research Council/United Kingdom
- 098051/WT_/Wellcome Trust/United Kingdom
- 100669/WT_/Wellcome Trust/United Kingdom
- MC_PC_U127561112/MRC_/Medical Research Council/United Kingdom
- 13031/CRUK_/Cancer Research UK/United Kingdom
- G0300212/MRC_/Medical Research Council/United Kingdom
- G1002082/MRC_/Medical Research Council/United Kingdom
LinkOut - more resources
Full Text Sources
Other Literature Sources
Molecular Biology Databases
