HRES-1/Rab4-mediated depletion of Drp1 impairs mitochondrial homeostasis and represents a target for treatment in SLE
- PMID: 23897774
- PMCID: PMC4047212
- DOI: 10.1136/annrheumdis-2013-203794
HRES-1/Rab4-mediated depletion of Drp1 impairs mitochondrial homeostasis and represents a target for treatment in SLE
Abstract
Objective: Accumulation of mitochondria underlies T-cell dysfunction in systemic lupus erythematosus (SLE). Mitochondrial turnover involves endosomal traffic regulated by HRES-1/Rab4, a small GTPase that is overexpressed in lupus T cells. Therefore, we investigated whether (1) HRES-1/Rab4 impacts mitochondrial homeostasis and (2) Rab geranylgeranyl transferase inhibitor 3-PEHPC blocks mitochondrial accumulation in T cells, autoimmunity and disease development in lupus-prone mice.
Methods: Mitochondria were evaluated in peripheral blood lymphocytes (PBL) of 38 SLE patients and 21 healthy controls and mouse models by flow cytometry, microscopy and western blot. MRL/lpr mice were treated with 125 μg/kg 3-PEHPC or 1 mg/kg rapamycin for 10 weeks, from 4 weeks of age. Disease was monitored by antinuclear antibody (ANA) production, proteinuria, and renal histology.
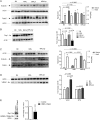
Results: Overexpression of HRES-1/Rab4 increased the mitochondrial mass of PBL (1.4-fold; p=0.019) and Jurkat cells (2-fold; p=0.000016) and depleted the mitophagy initiator protein Drp1 both in human (-49%; p=0.01) and mouse lymphocytes (-41%; p=0.03). Drp1 protein levels were profoundly diminished in PBL of SLE patients (-86±3%; p=0.012). T cells of 4-week-old MRL/lpr mice exhibited 4.7-fold over-expression of Rab4A (p=0.0002), the murine homologue of HRES-1/Rab4, and depletion of Drp1 that preceded the accumulation of mitochondria, ANA production and nephritis. 3-PEHPC increased Drp1 (p=0.03) and reduced mitochondrial mass in T cells (p=0.02) and diminished ANA production (p=0.021), proteinuria (p=0.00004), and nephritis scores of lupus-prone mice (p<0.001).
Conclusions: These data reveal a pathogenic role for HRES-1/Rab4-mediated Drp1 depletion and identify endocytic control of mitophagy as a treatment target in SLE.
Keywords: Autoimmune Diseases; Autoimmunity; Systemic Lupus Erythematosus.
Published by the BMJ Publishing Group Limited. For permission to use (where not already granted under a licence) please go to http://group.bmj.com/group/rights-licensing/permissions.
Figures


Similar articles
-
Mitochondrial Dysfunction in the Liver and Antiphospholipid Antibody Production Precede Disease Onset and Respond to Rapamycin in Lupus-Prone Mice.Arthritis Rheumatol. 2016 Nov;68(11):2728-2739. doi: 10.1002/art.39791. Arthritis Rheumatol. 2016. PMID: 27332042 Free PMC article.
-
Activation of mammalian target of rapamycin controls the loss of TCRzeta in lupus T cells through HRES-1/Rab4-regulated lysosomal degradation.J Immunol. 2009 Feb 15;182(4):2063-73. doi: 10.4049/jimmunol.0803600. J Immunol. 2009. PMID: 19201859 Free PMC article.
-
HRES-1/Rab4 promotes the formation of LC3(+) autophagosomes and the accumulation of mitochondria during autophagy.PLoS One. 2014 Jan 3;9(1):e84392. doi: 10.1371/journal.pone.0084392. eCollection 2014. PLoS One. 2014. PMID: 24404161 Free PMC article.
-
T-cell and B-cell signaling biomarkers and treatment targets in lupus.Curr Opin Rheumatol. 2009 Sep;21(5):454-64. doi: 10.1097/BOR.0b013e32832e977c. Curr Opin Rheumatol. 2009. PMID: 19550330 Free PMC article. Review.
-
[Mechanism of mitochondrial fission - structure and function of Drp1 protein].Postepy Biochem. 2016;62(2):127-137. Postepy Biochem. 2016. PMID: 28132464 Review. Polish.
Cited by
-
Lymphocyte Autophagy in Homeostasis, Activation, and Inflammatory Diseases.Front Immunol. 2018 Aug 6;9:1801. doi: 10.3389/fimmu.2018.01801. eCollection 2018. Front Immunol. 2018. PMID: 30127786 Free PMC article. Review.
-
Oxidative stress in the pathology and treatment of systemic lupus erythematosus.Nat Rev Rheumatol. 2013 Nov;9(11):674-86. doi: 10.1038/nrrheum.2013.147. Epub 2013 Oct 8. Nat Rev Rheumatol. 2013. PMID: 24100461 Free PMC article. Review.
-
Abnormal Glucose Metabolism in Alzheimer's Disease: Relation to Autophagy/Mitophagy and Therapeutic Approaches.Neurochem Res. 2015 Dec;40(12):2557-69. doi: 10.1007/s11064-015-1631-0. Epub 2015 Jun 16. Neurochem Res. 2015. PMID: 26077923 Free PMC article. Review.
-
Increased Mitochondrial Biogenesis and Reactive Oxygen Species Production Accompany Prolonged CD4+ T Cell Activation.J Immunol. 2018 Dec 1;201(11):3294-3306. doi: 10.4049/jimmunol.1800753. Epub 2018 Oct 29. J Immunol. 2018. PMID: 30373851 Free PMC article.
-
A Deep Insight Into Regulatory T Cell Metabolism in Renal Disease: Facts and Perspectives.Front Immunol. 2022 Feb 17;13:826732. doi: 10.3389/fimmu.2022.826732. eCollection 2022. Front Immunol. 2022. PMID: 35251009 Free PMC article. Review.
References
Publication types
MeSH terms
Substances
Grants and funding
LinkOut - more resources
Full Text Sources
Other Literature Sources
Medical
Miscellaneous
