. 2013 Aug 14;32(16):2231-47.
doi: 10.1038/emboj.2013.161. Epub 2013 Jul 26.

A direct physical interaction between Nanog and Sox2 regulates embryonic stem cell self-renewal

Affiliations

A direct physical interaction between Nanog and Sox2 regulates embryonic stem cell self-renewal

Alessia Gagliardi et al. EMBO J. .

Abstract

Embryonic stem (ES) cell self-renewal efficiency is determined by the Nanog protein level. However, the protein partners of Nanog that function to direct self-renewal are unclear. Here, we identify a Nanog interactome of over 130 proteins including transcription factors, chromatin modifying complexes, phosphorylation and ubiquitination enzymes, basal transcriptional machinery members, and RNA processing factors. Sox2 was identified as a robust interacting partner of Nanog. The purified Nanog-Sox2 complex identified a DNA recognition sequence present in multiple overlapping Nanog/Sox2 ChIP-Seq data sets. The Nanog tryptophan repeat region is necessary and sufficient for interaction with Sox2, with tryptophan residues required. In Sox2, tyrosine to alanine mutations within a triple-repeat motif (S X T/S Y) abrogates the Nanog-Sox2 interaction, alters expression of genes associated with the Nanog-Sox2 cognate sequence, and reduces the ability of Sox2 to rescue ES cell differentiation induced by endogenous Sox2 deletion. Substitution of the tyrosines with phenylalanine rescues both the Sox2-Nanog interaction and efficient self-renewal. These results suggest that aromatic stacking of Nanog tryptophans and Sox2 tyrosines mediates an interaction central to ES cell self-renewal.


Conflict of interest statement

The authors declare that they have no conflict of interest.

Figures
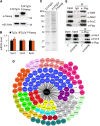
Figure 1
Figure 1
Characterization of E14Tg2a Flag Nanog cell line. (A) Expression levels of Nanog protein in E14Tg2a and E14Tg2a F-Nanog cells compared by immunoblot analysis using β-actin as a loading control. Note the reduced expression of endogenous Nanog protein in cells transfected with (Flag)3Nanog, consistent with autorepression of the Nanog gene by Nanog protein (Navarro et al, 2012a). (B) Expression levels of Sox2, Oct4 and Rex1 in E14Tg2a F-Nanog relative to E14Tg2a which was set to 1. Error bars are s.e.m. of three biological replicates. (C) Coomassie-stained SDS–polyacrylamide gel of the FLAG immunoprecipitation from E14Tg2a F-Nanog and control E14Tg2a cells. (D) Proteins detected by mass spectrometry analysis are grouped in classes. Transcription factors are shown in blue circles, NuRD components are in green, Trrap/p400 complex is in yellow, PcG components are in red, E2F6 complex is in purple, Sin3a complex is in burgundy, N-CoR complex is in khaki, LSD1 complex is white, Mll complex is in blue green, chromatin remodelling/transcriptional regulation proteins are in dark orange, transcriptional machinery proteins are in pale green, proteins involved in phosphorylation are in pale blue, proteins involved in ubiquitination are in amber, proteins involved in RNA processing are in fuschia, proteins involved in cell cycle or DNA replication are in coral, proteins involved in DNA repair are in pink and other proteins are in grey. (E) Nuclear extracts from E14Tg2a F-Nanog cells (top) or from RCNβH-B(t):F-Nanog (bottom) were immunoprecipitated as indicated and immunoblots analysed with the indicated antibodies. In the bottom panel, C refers to control samples from RCNβH-B(t) parental cells. Source data for this figure is available on the online supplementary information page.
Figure 2
Figure 2
The Nanog interaction network. The Nanog interactome (pale blue) as part of a larger interactome encompassing the interactions of Oct4, Esrrb, Sall4, Nr0b1 and Tcfcp2l1 (van den Berg et al, 2010).
Figure 3
Figure 3
Mutational analysis of the Sox2-interaction domain in Nanog. (A) Co-immunoprecipitation of endogenous Sox2 and Nanog from E14Tg2a nuclear extract. Immunoprecipitation was performed with Sox2 antibody and immunoblot probed with anti-Nanog or anti-Sox2 antibodies. (B) Co-immunoprecipitation of endogenous Nanog and Sox2 from E14Tg2a nuclear extract. Immunoprecipitation was performed with Nanog antibody and immunoblot probed with anti-Sox2 or anti-Nanog antibodies. (C) Left, schematic representation of the (HA)3Nanog constructs. Right, co-immunoprecipitations of Nanog variants with Sox2. (FLAG)3Sox2 and (HA)3Nanog deletion mutants were transfected into E14/T cells. Immunoprecipitations were performed with an HA antibody as indicated and immunoblots probed with anti-FLAG or anti-HA antibodies. I is 1% of input. (D) Left, schematic representation of the (HA)3Nanog constructs. Right, co-immunoprecipitations of Nanog variants with Sox2. (FLAG)3Sox2 and (HA)3Nanog deletion mutants were transfected into E14/T cells. Immunoprecipitations were performed with an HA antibody as indicated and immunoblots probed with anti-FLAG or anti-HA antibodies. I is 1% of input. (E) Left, Sox2, co-expressed in E. coli with either a Maltose Binding Protein-tryptophan repeat (MBP-WR) fusion protein or a Maltose Binding Protein-tryptophan repeat in which all the tryptophans were mutated to alanine (MBP-WRW10-A). Right, MBP fusion proteins and associated proteins were purified on amylose resin, subjected to SDS–PAGE and immunoblots probed with Sox2 or MBP antibodies. Source data for this figure is available on the online supplementary information page.
Figure 4
Figure 4
The serine-rich domain of Sox2 interacts with Nanog. (A) Top, schematic representation of the (FLAG)3Sox2 constructs. Bottom, (HA)3Nanog and the indicated (FLAG)3Sox2 deletion mutants were transfected into E14/T cells and immunoprecipitations were performed with an HA antibody as indicated and immunoblots probed with anti-FLAG or anti-HA antibodies. I is 1% of input. (B) Left, schematic representation of the (FLAG)3Sox2 and (HA)3Nanog constructs used to assess the DNA independence of the Nanog–Sox2 interaction. Right, E14/T cells were transfected with the indicated vectors. Immunoprecipitations were performed with an HA antibody as indicated and immunoblots probed with anti-FLAG or anti-HA antibodies. I is 1% of input. Source data for this figure is available on the online supplementary information page.
Figure 5
Figure 5
A subregion of the Sox2 serine-rich domain interacts with Nanog. (A) Schematic representation of the (FLAG)3Sox2 constructs used for mapping the minimal Sox2 region involved in the interaction with Nanog. (B) E14/T cells were transfected with (HA)3Nanog and the indicated (FLAG)3Sox2 mutants. Immunoprecipitations were performed with an HA antibody as indicated and immunoblots probed with an anti-FLAG or anti-HA antibodies. I is 1% of input. Source data for this figure is available on the online supplementary information page.
Figure 6
Figure 6
Identification of amino-acid residues within Sox2(213–233) interacting with Nanog. (A) Top, schematic representation of hydroxyamino acid mutations in repeats 1, 2 or 3 in Sox2. Bottom, E14/T cells were transfected with (HA)3Nanog and the indicated (FLAG)3Sox2 mutants. Immunoblots of the HA immunoprecipitates were analysed by immunoblotting with an anti-FLAG or an anti-HA antibody. I is 1% of input. (B) Top, schematic representation of the combinatorial mutations of the hydroxyamino acids in repeats 1, 2 and 3 of Sox2. Bottom, E14/T cells were transfected with (HA)3Nanog and the indicated (FLAG)3Sox2 mutants. Immunoblots of the HA immunoprecipitates were analysed by immunoblotting with an anti-FLAG or an anti-HA antibody. I is 1% of input. (C) Top, schematic representation of the mutations of the hydroxyamino acids in positions 1, 3 or 4 of repeats 1, 2 and 3 of Sox2. Bottom, E14/T cells were transfected with (HA)3Nanog and the indicated (FLAG)3Sox2 mutants. Immunoblots of the HA immunoprecipitates were analysed by immunoblotting with an anti-FLAG or an anti-HA antibody. I is 1% of input. (D) Top, schematic representation of the mutations of the hydroxyamino acids in position 4 of repeats 1, 2 and 3 of Sox2. Bottom, E14/T cells were transfected with (HA)3Nanog and the indicated (FLAG)3Sox2 mutants. Immunoblots of the HA immunoprecipitates were analysed by immunoblotting with an anti-FLAG or an anti-HA antibody. I is 1% of input. Source data for this figure is available on the online supplementary information page.
Figure 7
Figure 7
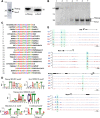
Identification of a Nanog/Sox2 motif by SELEX. (A) Left, a Coomassie-stained SDS–PAGE gel of the imidazole eluate from the Ni-agarose purification of lysate from E. coli expressing His6-Nanog and Sox2, showing the major two bands identified as containing Nanog (upper) and Sox2 (lower) by immunoblot analysis, as indicated on the right-hand panel. (B) Coomassie-stained SDS–PAGE gel of fractions from ion-exchange purification of Nanog/Sox2. Lanes 1–3 are protein from flow-through fractions and lanes 4–7 are from the eluted peak. (C) Sequence of 22 oligonucleotides that contribute to the motif generated by the de novo discovery program MEME. (D) Top panel, SELEX motifs generated for Nanog and Sox2 expressed individually from a total of 19 (Nanog) and 15 (Sox2) sequences submitted to MEME; middle panel, SELEX motif generated for Nanog/Sox2 complex from 38 sequences submitted to MEME; bottom panel, representation of the de novo Nanog/Sox2 motif (Hutchins et al, 2013) and the combined motif from SELEX sequence for Nanog/Sox2 and de novo Nanog/Sox2 motif. Motifs in the bottom panels were generated with Web Logo 3.3. (E) Nanog and Sox2 ChIP-seq peaks located near the transcriptional start sites of Zfp42, Klf5, Ncam1 and Myst4. The peaks that contain the Nanog/Sox2 motif are highlighted in the shaded box; Nanog (N) and Sox2 (S) peaks in data sets from Chen (C), Marson (M) and Whyte (W) data sets. Source data for this figure is available on the online supplementary information page.
Figure 8
Figure 8
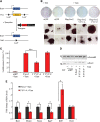
The aromatic tyrosine side chains of the Nanog-interaction domain are required to fully rescue differentiation of Sox2 null ES cells. (A) Scheme of the Sox2 conditional knock-out (Sox2CKO) cell line. (B) Top, alkaline phosphatase staining of the Sox2 null rescued cells. Sox2CKO was transfected with the indicated vectors, selected in hygromycin and cultured in the presence or absence of tamoxifen. Cells were grown at clonal density for 7 days before staining. Bottom, two representative fields of colonies obtained for the indicated treatments. (C) Quantification of the data from B. The number of alkaline phosphatase-positive colonies formed following transfection with the indicated vector was calculated as a proportion of the number obtained by transfection with (Flag)3Sox2, which was set as 100%. Error bars, s.e.m. of at least four independent experiments. ***Differences between FSox2 and FSox2:YYY>A by Mann–Whitney test (P<0.001). (D) Expression level of Flag-Sox2 variants in clonal assay. Comparison of Sox2 expression in E14Tg2a (WT) with Sox2 CKO populations expressing eGFP, Flag-Sox2, FlagSox2:YYY>A, FlagSox2:YYY>F, plated at clonal density for 7 days. (E) Expression levels of Nanog/Sox2 target genes. Expression levels of Rex1, Myst4, Ncam, Itga9, Klf5 and Oct4 in cells plated at clonal density, treated with tamoxifen for 12 h and grown for 7 days before RNA extraction. The expression level in Sox2CKO F-Sox2 +tamoxifen was set to 1. Error bars, s.e.m. of three biological replicates. *Differences between FSox2 and FSox2:YYY>A by two-tailed t-test (P<0.05). Source data for this figure is available on the online supplementary information page.

Similar articles

Cited by

References

    1. Ambrosetti DC, Basilico C, Dailey L (1997) Synergistic activation of the fibroblast growth factor 4 enhancer by Sox2 and Oct-3 depends on protein-protein interactions facilitated by a specific spatial arrangement of factor binding sites. Mol Cell Biol 17: 6321–6329 - PMC - PubMed
    1. Ambrosetti DC, Scholer HR, Dailey L, Basilico C (2000) Modulation of the activity of multiple transcriptional activation domains by the DNA binding domains mediates the synergistic action of Sox2 and Oct-3 on the fibroblast growth factor-4 enhancer. J Biol Chem 275: 23387–23397 - PubMed
    1. Avilion AA, Nicolis SK, Pevny LH, Perez L, Vivian N, Lovell-Badge R (2003) Multipotent cell lineages in early mouse development depend on SOX2 function. Genes Dev 17: 126–140 - PMC - PubMed
    1. Bailey TL, Boden M, Buske FA, Frith M, Grant CE, Clementi L, Ren J, Li WW, Noble WS (2009) MEME SUITE: tools for motif discovery and searching. Nucleic Acids Res 37: Web Server issueW202–W208 - PMC - PubMed
    1. Bogan AA, Thorn KS (1998) Anatomy of hot spots in protein interfaces. J Mol Biol 280: 1–9 - PubMed

Publication types