. 2013 Nov;145(5):1121-32.
doi: 10.1053/j.gastro.2013.07.025. Epub 2013 Jul 25.

Activated pancreatic stellate cells sequester CD8+ T cells to reduce their infiltration of the juxtatumoral compartment of pancreatic ductal adenocarcinoma

Affiliations

Activated pancreatic stellate cells sequester CD8+ T cells to reduce their infiltration of the juxtatumoral compartment of pancreatic ductal adenocarcinoma

Abasi Ene-Obong et al. Gastroenterology. 2013 Nov.

Abstract

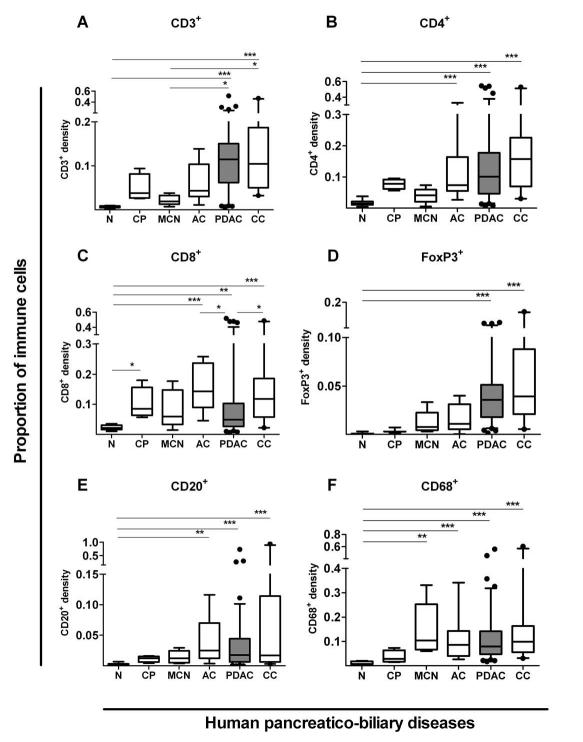
Background & aims: Pancreatic ductal adenocarcinoma (PDAC) is characterized by a prominent desmoplastic microenvironment that contains many different immune cells. Activated pancreatic stellate cells (PSCs) contribute to the desmoplasia. We investigated whether distinct stromal compartments are differentially infiltrated by different types of immune cells.

Methods: We used tissue microarray analysis to compare immune cell infiltration of different pancreaticobiliary diseased tissues (PDAC, ampullary carcinoma, cholangiocarcinoma, mucinous cystic neoplasm, chronic inflammation, and chronic pancreatitis) and juxtatumoral stromal (<100 μm from tumor) and panstromal compartments. We investigated the association between immune infiltrate and patient survival times. We also analyzed T-cell migration and tumor infiltration in LSL-KrasG12D/+; LSL-Trp53R172H/+; Pdx-1-Cre (KPC) mice and the effects of all-trans retinoic acid (ATRA) on these processes.

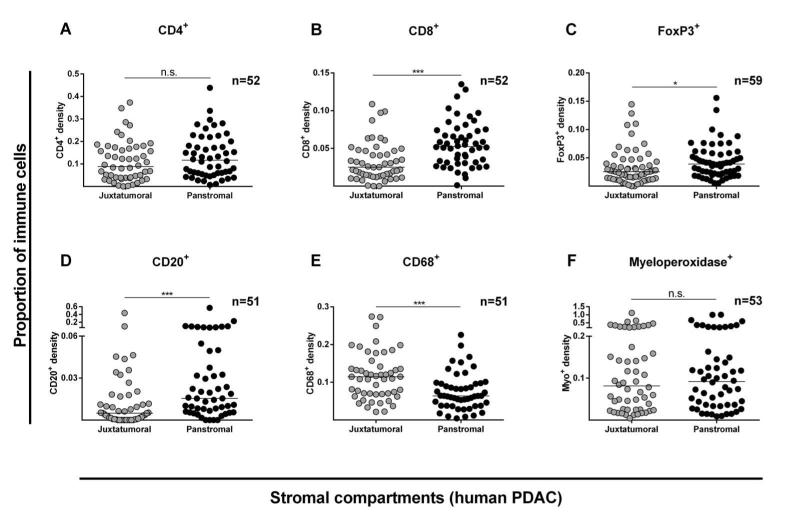
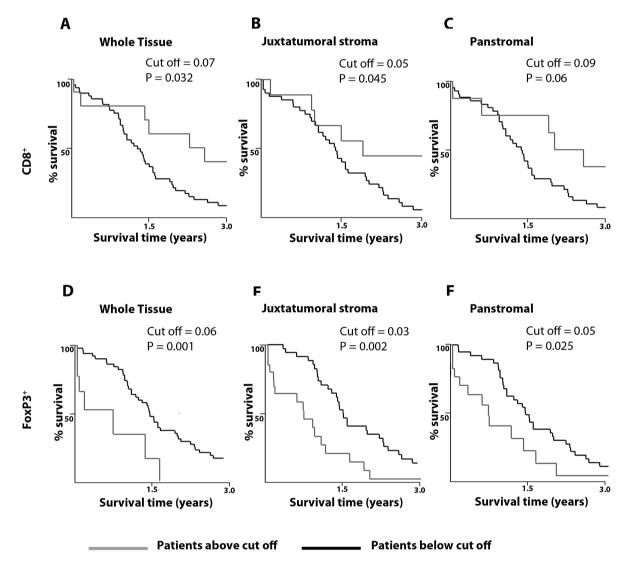
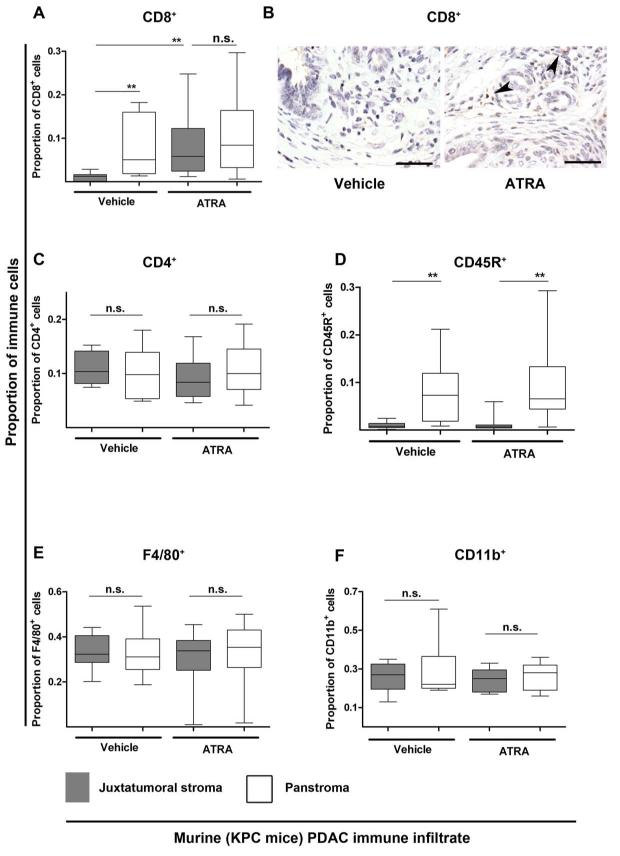
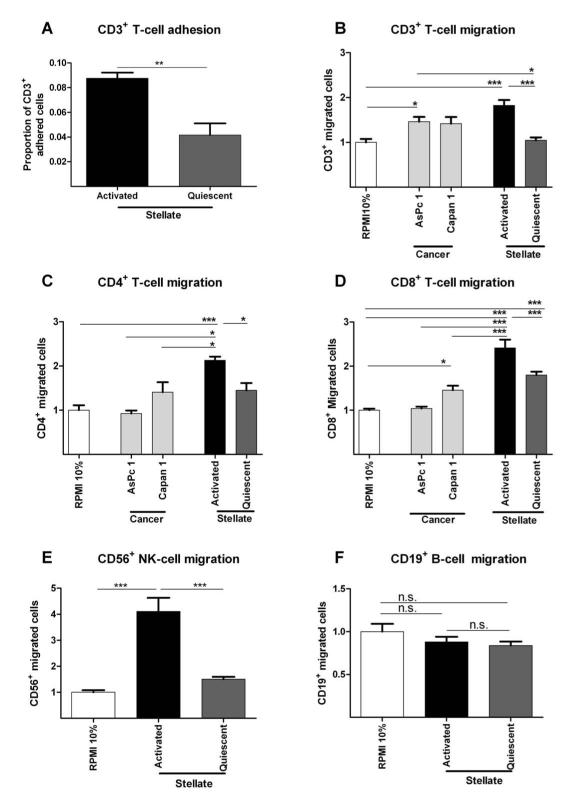
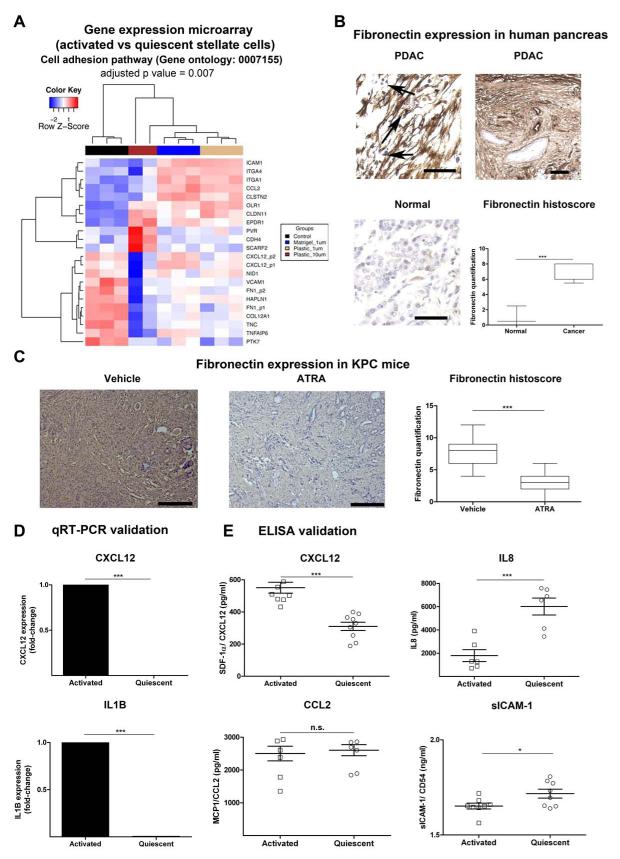
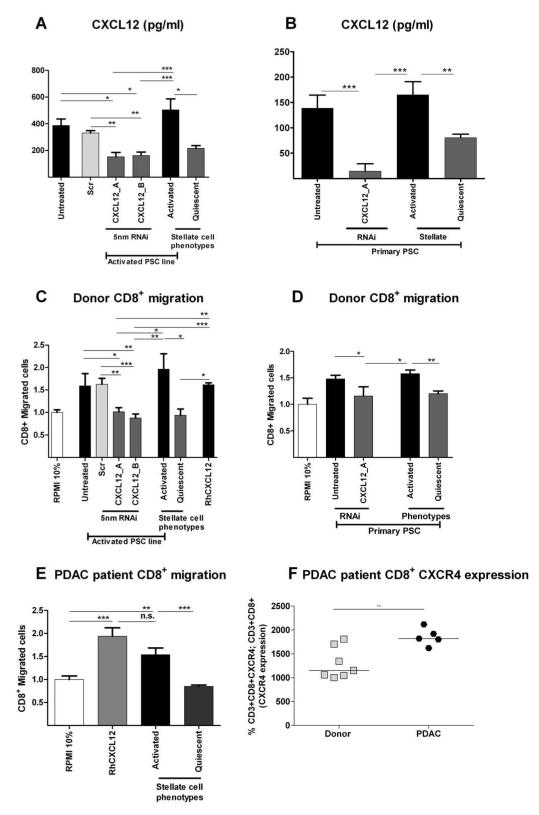
Results: Juxtatumoral compartments in PDAC samples from 2 independent groups of patients contained increased numbers of myeloperoxidase(+) and CD68(+) cells compared with panstromal compartments. However, juxtatumoral compartments of PDACs contained fewer CD8(+), FoxP3(+), CD56(+), or CD20(+) cells than panstromal compartments, a distinction absent in ampullary carcinomas and cholangiocarcinomas. Patients with PDACs that had high densities of CD8(+) T cells in the juxtatumoral compartment had longer survival times than patients with lower densities. In KPC mice, administration of ATRA, which renders PSCs quiescent, increased numbers of CD8(+) T cells in juxtatumoral compartments. We found that activated PSCs express cytokines, chemokines, and adhesion molecules that regulate T-cell migration. In vitro migration assays showed that CD8(+) T cells, from patients with PDAC, had increased chemotaxis toward activated PSCs, which secrete CXCL12, compared with quiescent PSCs or tumor cells. These effects could be reversed by knockdown of CXCL12 or treatment of PSCs with ATRA.

Conclusions: Based on studies of human PDAC samples and KPC mice, activated PSCs appear to reduce migration of CD8(+) T cells to juxtatumoral stromal compartments, preventing their access to cancer cells. Deregulated signaling by activated PSCs could prevent an effective antitumor immune response.

Keywords: AC; ATRA; Antitumor Immunity; CC; Immune Regulation; MDSC; Mouse Model; PBD; PDAC; PSC; Pancreatic Cancer; TMA; Treg; aPSC; activated pancreatic stellate cell; all-trans retinoic acid; ampullary carcinoma; cholangiocarcinoma; myeloid-derived suppressor cell; pancreatic ductal adenocarcinoma; pancreatic stellate cell; pancreaticobiliary disease; qPSC; quiescent pancreatic stellate cell; regulatory T cell; tissue microarray.


Figures

Figure 1
Figure 1. Immune cell infiltrate in human pancreatico-biliary diseases
Immune cells infiltrates were measured in pancreatico-biliary diseases such as chronic pancreatitis (CP, n=4), mucinous cystic neoplasms (MCN, n=6), ampullary carcinoma (AC, n=9), pancreatic ductal adenocarcinoma (PDAC, n=93-98, shaded box), cholangiocarcinoma (CC, n=21) and normal tissues (N, n=11-14) using Ariol (Genetix) software as described in Supplementary Figures 1-4. Box (median with interquartile ranges (25th and 75th)) and whisker (5th and 95th centiles) plots (outliers are represented by individual dots) demonstrate that all diseases demonstrate significant, yet varied, density and profile for CD3+(A), CD4+(B), CD8+(C), CD20+(D), FoxP3+(E), and CD68+(F) immune cells infiltrate as compared by Kruskal-Wallis test (p-value < 0.0001 for all immune cells). Further statistical comparisons between columns were done by Dunn’s post test and indicated by *** p< 0.001; ** p= 0.001 to 0.01; * p= 0.01 to 0.05.
Figure 2
Figure 2. Stromal compartment specific immune cell infiltration in human PDAC
Proportion of immune cell infiltrate was determined as shown in Supplementary Figure 1-4. Juxtatumoral stromal (within 100μm of tumor cells (single or islands /ducts)) and panstromal (the rest of the tumor stroma) were defined. Each data point represents a single patient (median scores of all TMA cores (n=6)) and lines represent median for the cohort of patients. Comparison of immune cell infiltration in these two PDAC stromal compartments was made for CD4+ (A), CD8+ (B), FoxP3+ (C), CD20+ (D), CD68+ (E) and Myeloperoxidase+ (F) cells, and also for CD3+ and CD56+ cells (Supplementary Figure 5). Whilst PDAC tissues demonstrate a significantly higher density in the juxtatumoral stroma relative to the panstromal compartment for CD68+ cells, the reverse was true for CD8+, FoxP3+ and CD20+ cells with an equal density for CD4+ and Myeloperoxidase+ cells implying a differential immune cell infiltration defect. Mann Whitney U test; p-values are two-tailed.
Figure 3
Figure 3. Correlation of stromal compartment-specific immune cell infiltration with survival
Prognostic implications upon differential immune cell infiltration for CD8+ (A-C) and FoxP3+ (D-F) cells in whole PDAC tissue (A, D), the juxtatumoral compartment (B, E) and the panstromal compartment (C, F) was determined using optimal cut-off for proportion of immune cells using X-tile software (Yale).- Survival comparisons were made between patients with low (black) and high (grey) density of the immune cell infiltrate. Miller-Seigmund corrections of p-values were performed to account for multiple comparisons (Supplementary table 5). The various optimal cut-off for proportion of immune cells defining high versus low infiltrate are indicated. Patients with high densities of CD8+ in the whole PDAC tissue (A) or the juxtatumoral compartment (B) demonstrate a statistically significant survival benefit; however, this was not true for panstromal compartment (C). Lower FoxP3+ infiltration in all compartments resulted in better survival.
Figure 4
Figure 4. Juxtatumoral exclusion of CD8+ T-cells in KPC mice is reversed upon stromal collapse engineered by targeting stellate cells with ATRA
KPC mice with fully developed tumours (day 60-200) were enrolled into a pre-clinical trial where they were either given vehicle (n=4) or ATRA (n=6). ATRA, selectively targets and restores stellate cells quiescence. Proportion of CD8+ (A,B), CD4+ (C), CD45R+ (D), F4/80+ (E) and CD11b+ (F) cells in the panstromal and juxtatumoral compartments were measured as shown in Supplementary Figure 12. All data are presented as box (median with interquartile ranges (25th and 75th)) and whisker (5th and 95th centiles) plots. The juxtatumoral exclusion of CD8+ (cytotoxic T-cells) and CD45R+ (B-cells) cells was demonstrated in vehicle-treated mice. There was a significant increase in the CD8+ T-cell infiltrate (A,B) into the juxtatumoral compartment upon treatment of mice with ATRA which was not seen for CD4+ (helper T-cells), CD45R+ (B-cells), F4/80+ (macrophages) or CD11b+ (MDSC) cells. Scale bar: 100μm Mann-Whitney U-test, all p-values are two-tailed. ** p= 0.001 to 0.01; n.s.= not significant
Figure 5
Figure 5. In vitro immune-stellate cells interactions
Immuno-magnetic bead separated immune cells from un-diseased human donors (n=4) were used. Pancreatic stellate cells (PSC) were rendered quiescent using ATRA. Proportion of adherent T-cells to aPSCs or qPSCs were quantified after incubation for one hour and fixation and staining. (A; paired t-test; p-value is two-tailed). Transwell (5 μm) migration assays of different immune cells towards conditioned media (CM) from activated (aPSC), quiescent (qPSC) PSC and cancer cells (Capan1 and AsPc1) were carried out over 4-8 hours. Background migration of T-cells towards serum-free RPMI was subtracted to give ‘specific’ migration and normalized to migration towards RPMI supplemented with 10% FBS (‘basal’ serum directed migration) as shown in Supplementary Figure 13. These conditions served as internal controls for comparison across biological replicates. We demonstrated reduced migration of CD3+ (B), CD4+ (C) and CD8+ (D), CD56+ (E) but not CD19+ qPSC CM compared with aPSC CM. The absolute CD4+ (B) cell number migration was minimal with little difference over the basal migration. Migration of all subsets of T-cells towards aPSC CM was higher than migration towards cancer cell CM. The most dramatic, and perhaps clinically relevant, fold change in migration of T-cells was seen with CD8+ T-cells (D) and NK cells (E). Bar chart represents mean ± SEM. *** p< 0.001; ** p= 0.001 to 0.01; * p= 0.01 to 0.05, Comparisons were conducted with ANOVA with comparisons between columns using Bonferroni’s Multiple Comparison Test.
Figure 6
Figure 6. Adhesion molecule and cytokine changes upon activation of PSC
(A) Re-analysis of gene expression microarrays of qPSC compared to aPSC for significantly differentially expressed genes involved in cell adhesion (Gene Ontology GO:0007155) gene set enrichment test = 0.007, performed using DAVID (Benjamini-Hochberg test). Hierarchy clustering of all samples (replicates) from four groups, aPSC or control (black) and qPSC under different treatment conditions such as when plated on Matrigel and treated with 1 μM ATRA (blue), when plated on Plastic and treated with 1 μM ATRA (burlywood) and plastic with 10 μM ATRA (dark brown), was performed based on the expression profiles of these differentially expressed probes using the Euclidean metric. Also see Supplementary Figure 14 for the significant changes in gene expression derived from the time-course experiment as well as changes in cytokine-cytokine receptor interaction pathway. (B) Fibronectin was further assessed in normal human pancreas and human PDAC demonstrating upregulation of fibronectin expression in cancer, particularly in the panstromal compartment where they sequester immune cells (black arrow). Scale bar, 100 μm. Box (median with interquartile ranges (25th and 75th)) and whisker (5th and 95th centiles) plots of fibronectin immunostain is demonstrated. Mann-Whitney U-test. (C) Upon treatment with ATRA, KPC mice demonstrated a significant reduction of fibronectin deposition. Scale bar, 100 μm. Box (median with interquartile ranges (25th and 75th)) and whisker (5th and 95th centiles) plots of fibronectin immunostain is demonstrated. Mann-Whitney U-test. (D) qRT-PCR demonstrated significant alteration of some of the transcripts identified by gene-expression microarray analysis. Other transcripts have been studied before. Bar chart represents mean ± SEM. Paired t-test; p values are two-tailed. (E) Concentrations of the proteins in conditioned media collected from qPSC and aPSC using ELISA. Surprisingly at protein level, there was no/little difference in secretion between qPSC and aPSC for sICAM1/ CD54 and MCP1/ CCL2. However, confirming the gene expression data, aPSC secreted less IL8 than qPSC and the reverse was true for SDF-1α/ CXCL12. Summary data represents mean ± SEM. Paired t-test; p values are two-tailed.
Figure 7
Figure 7. T-cell migration is mediated by CXCL12
CXCL12 was knocked down in PSC cell line (PS1: A) and primary PSCs (B) with two distinct targeting siRNAs and appropriate controls. CXCL12 secretion was measured in conditioned media. PSC treated with siRNA for CXCL12 demonstrated significant reduction of CXCL12 secretion (A,B) which was equivalent to quiescent PSC levels. Migration of normal human donor CD8+ T-cells to conditioned media of CXCL12 knockdown PSC (C: PS1 cell line and D: primary PSC) demonstrated significant reduction, which was equivalent to qPSC levels. Similar results were found with PDAC patient CD8+ T-cells (E). PDAC patient CD8+ T-cells demonstrated significant upregulation of CXCR4 as measured by Flow-cytometry (F). *** p< 0.001; ** p= 0.001 to 0.01; * p= 0.01 to 0.05. Comparisons were conducted with ANOVA with comparisons between columns using Bonferroni’s Multiple Comparison Test.

Similar articles

Cited by

References

    1. Perez-Mancera PA, Guerra C, Barbacid M, et al. What We Have Learned About Pancreatic Cancer from Mouse Models. Gastroenterology. 2012 - PubMed
    1. Schreiber RD, Old LJ, Smyth MJ. Cancer immunoediting: integrating immunity’s roles in cancer suppression and promotion. Science. 2011;331:1565–70. - PubMed
    1. Vesely MD, Kershaw MH, Schreiber RD, et al. Natural innate and adaptive immunity to cancer. Annu Rev Immunol. 2011;29:235–71. - PubMed
    1. Restifo NP, Dudley ME, Rosenberg SA. Adoptive immunotherapy for cancer: harnessing the T cell response. Nat Rev Immunol. 2012;12:269–81. - PMC - PubMed
    1. Matsushita H, Vesely MD, Koboldt DC, et al. Cancer exome analysis reveals a T-cell-dependent mechanism of cancer immunoediting. Nature. 2011;482:400–4. - PMC - PubMed

Publication types

MeSH terms