. 2013 Jul 29;26(2):204-19.
doi: 10.1016/j.devcel.2013.06.017. Epub 2013 Jul 18.

Molecular signatures of tissue-specific microvascular endothelial cell heterogeneity in organ maintenance and regeneration

Affiliations

Molecular signatures of tissue-specific microvascular endothelial cell heterogeneity in organ maintenance and regeneration

Daniel J Nolan et al. Dev Cell. .

Abstract

Microvascular endothelial cells (ECs) within different tissues are endowed with distinct but as yet unrecognized structural, phenotypic, and functional attributes. We devised EC purification, cultivation, profiling, and transplantation models that establish tissue-specific molecular libraries of ECs devoid of lymphatic ECs or parenchymal cells. These libraries identify attributes that confer ECs with their organotypic features. We show that clusters of transcription factors, angiocrine growth factors, adhesion molecules, and chemokines are expressed in unique combinations by ECs of each organ. Furthermore, ECs respond distinctly in tissue regeneration models, hepatectomy, and myeloablation. To test the data set, we developed a transplantation model that employs generic ECs differentiated from embryonic stem cells. Transplanted generic ECs engraft into regenerating tissues and acquire features of organotypic ECs. Collectively, we demonstrate the utility of informational databases of ECs toward uncovering the extravascular and intrinsic signals that define EC heterogeneity. These factors could be exploited therapeutically to engineer tissue-specific ECs for regeneration.


Figures

Figure 1
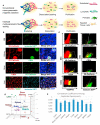
Figure 1. Determination of Tissue-Specific Vascular Signature of ECs Purified by Intravital Staining
(A) Schematic model of conventional EC isolations utilizing magnetic beads after tissue dissociation compared to intravital labeling with multiple fluorescent markers in vivo, which results in enhanced purities. (B) Wild-type (WT) animals were coinjected with fluorescently labeled antibodies and IsolectinGSIB4 8 min prior to sacrifice. Primary channels (left) provided for the clearest resolution of the ECs, secondary channels (middle) confirmed the cell as EC via microscopy. Sections were counterstained with DAPI (right). (C) The identical markers from (B) were applied to flow cytometric analysis. Tissues from intravitally labeled animals were enzymatically dissociated. Red cells noted in the scatterplots only include live single cells without highly autofluorescent, nonspecific IgG binding cells, or aggregates of two or more cells. Cells highlighted in yellow are positive for the primary-specific EC marker and then interrogated in a secondary channel. Double positive cells are shown in green. (D) Genome-wide principal component analysis (PCA) of the nine tissues profiled showing the individual replicates from each tissue. Tissues are color-coded corresponding to their label. (E) Correlation coefficients are presented for the transcriptional profiling among the biological triplicates demonstrating high fidelity. Scale bars represent 100 μm, error bars represent SD. See also Figures S1 and S2.
Figure 2
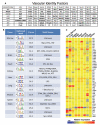
Figure 2. Transcriptional Regulation of EC Fate and Tissue-Specific Heterogeneity
(A) A list of Gene Ontology-annotated transcription factors is presented, selected for consistent expression in seven of nine of the profiled ECs and in the top 20th percentile of transcripts of each of the biological triplicates. Further emphasis was placed on transcription factors present in all nine tissues in triplicate in the top tenth percentile with bold lettering (B) High-scoring DNA motifs uncovered by de novo motif analysis in the promoters of genes with high expression in tissue-specific ECs are presented. The Z score indicates the statistical strength of motif overrepresentation in this tissue. Motif names are shown when a match to a transcription factor-binding site in JASPAR or TRANSFAC could be found. Motif matching was performed using the CompareACE approach, using 0.8 as threshold. (C) Corresponding transcript levels of transcription factor candidates represented in (B) are shown. See also Figure S3.
Figure 3
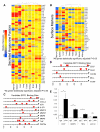
Figure 3. Hierarchical Clustering of Heterogeneous Factors with ETS-Factor Promoter Binding
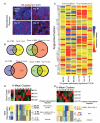
(A) Hierarchical clustering of selected organ-specific angiocrine factors deviating 2-fold or greater from mean expression with statistical significance (Benjamini-Hochberg adjusted p < 0.05), including growth factors, cytokines, and ECM are presented. Red denotes higher than average expression, blue denotes lower than average expression. (B) Selected cell surface receptors are also depicted in a hierarchical cluster, all genes listed are statistically significant (Benjamini-Hochberg adjusted p < 0.05). (C and D) The first 1,000 bases upstream of the start codon of angiocrine factors and surface markers were upregulated in the bone marrow (BM). ECs were analyzed for potential SFPI1 binding sites and are marked by red triangles. SFPI1 binding in the promoters of CD37, MMP9, and TNF promoter was analyzed by ChIP targeting potential SFPI1 binding sites and a control region without SFPI binding. (E) Antibodies and genomic regions are indicated on the x axis and the amount of recovered DNA as indicated by percent of the input DNA is indicated on the y axis. Error bars represent SD. Asterisk (*) denotes statistical significance p < 0.05. See also Figure S4.
Figure 4
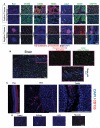
Figure 4. Validations of Differentially Expressed Targets among Vascular Beds
(A) Representative images of various markers confirmed to have higher expression among organotypic ECs. ECs with positive intravital labeling in some or all vessels are shown as the top pair of images; tissues with no discernible staining are shown as the lower pair of images. Each pair of images represent merged images with VE-Cadherin or Isolectin (red) and the targeted stain alone (green). Scale bar represents 50 μm. (B) Representative image of animal tissues intravitally labeled with fluorescent CD34 antibody and poststained for Prominin1 (CD133) after cryopreservation and sectioning in both a low-magnification and high-magnification region (highlighted in pink) showing costaining by both markers. (C) Intravital injections of Prominin1 antibody confirm protein expression on the ECs of the eye, skin, and dimly on the testis. Scale bars represent 100 μm. (D) An example of tissues with no detectable Prominin1 expression after intravital injections is shown. Scale bars represent 100 μm.
Figure 5
Figure 5. Tissue-Specific Angiocrine Responses Are Dynamic and Modular during Organ Regeneration
(A) Representative images of intravital labeling for VE-Cadherin (red) and counterstained with DAPI (blue) demonstrating that the bone marrow (BM) vasculature maintains functional blood flow throughout myeloablation and recovery. Scale bar represents 50 μm. (B) Venn diagrams depicting statistically significant (p < 0.05), 2-fold differentially regulated genes between recovering BM ECs and liver ECs after myeloablation and hepatectomy across all time points, respectively (B). (C) Selective groups of angiocrine factors between steady state ECs in the BM (BM SS) and 10 and 28 days postsublethal 650 Rad radiation along with steady state liver ECs (Liver SS) and ECs 2 and 6 days after partial hepatectomy (p < 0.05 for all genes shown. (D and E) The upper red and green heat map represents K-Means clusters of genes, which are specific to steady state, the early phases of recovery, the late phase of recovery, and combinations of these phases. Each column in the heat map represents a different group of clustered genes, numbered 1–10. The lower heat map depicts the results of de novo motif discovery in either BM (D) or liver (E) on the upregulated genes of the corresponding columns. Identified motifs found via de novo motif analysis in each cluster and their corresponding potential binding factors are listed. In each row, the color indicates whether the motif is overrepresented in a group (yellow) or underrepresented (blue).
Figure 6
Figure 6. ECs Derived from hESCs Phenocopy Adult Mouse Tissue-Specific Capillaries
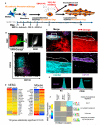
(A) Schema of in vitro conditions to support the differentiation and identification of hESC-derived vasculature. hESCs are grown on an E4-ORF1 EC feeder layer and transduced with a VE-Cadherin-Orange reporter gene. VE-Cadherin-Orange+ vascular networks are readily identifiable by day 10. (B) Flow cytometry data depicting the expression of VPR-Orange on hESC-derived CD31+ ECs. These VPR+ ECs have distinct populations based on the expression of either CXCR4 (teal) or CD133 (purple). (C) VPR+CXCR4+CD133 and VPR+CD133+CXCR4 ECs are capable of forming distinct clusters of ECs in hESC cultures. (D) Heat maps of the genes, which were common in their statistically significant differential expression (Benjamini-Hochberg adjusted p < 0.05) between hESC-derived vasculature and adult mouse heart and brain tissues. (E) VPR+CXCR4+CD133 and VPR+CD133+CXCR4 ECs were analyzed for cKit and CD36 levels via flow cytometry. Validation of the higher expression of CD36 and Kit in the CXCR4+ ECs is shown. (F) Heat map of K-Mean clusters depicting the results of de novo motif discovery among non-ECs, CXCR4+VPR+ ECs, and CD133+VPR+ ECs. Candidate binding partners to the motifs are listed.
Figure 7
Figure 7. Transplantation and In Vivo Education of Engrafted mESC-ECs in Multiple Tissues
(A) C57BL/6 mESC cultures were induced toward the EC fate. Two weeks after plating mouse embryoid bodies (EBs), VE-Cadherin+ cells were purified and expanded independently of other cell types. Purified mESC-ECs maintain vascular identity as evident by sustained VE-Cadherin and CD31 expression. (B) C57BL/6 animals underwent 70% partial hepatectomy by the removal of the three most anterior lobes (dashed blue line) and simultaneously were injected intrasplenically with 500,000 syngeneic GFP-labeled mESC-ECs. (C) Transplanted animals were intravitally labeled with VE-Cadherin and IgG antibodies to identify ECs. GFP+ mESC-ECs were found to consist of ~60% of the vasculature in the regenerating liver by flow cytometric analysis. (D) Microscopic quantification of engrafted mESC-ECs in the kidney and liver is presented depicting the percentage within the liver and kidney expressing VEGFR3 and CD34. Results are statistically significant (p < 0.05, t test). (E) Tissue sections of the regenerated liver (left) and kidney (right) were postfixation stained for VEGFR3, CD34, VCAM, Endoglin, and Tie2. Luminal incorporated mESC-ECs acquire structural and phenotypic attributes of native ECs. Scale bar represents 50 μm, error bars represent SD. (F) Regions from (E) highlighted in yellow are presented in 3D to highlight the expression of the markers directly on the functionally engrafted mESC-ECs. See also Figure S5.

Similar articles

Cited by

References

    1. Ahn J, Ko M, Lee K, Oh J, Jeon SH, Seong RH. Expression of SRG3, a core component of mouse SWI/SNF chromatin-remodeling complex, is regulated by cooperative interactions between Sp1/Sp3 and Ets transcription factors. Biochem. Biophys. Res. Commun. 2005;338:1435–1446. - PubMed
    1. Aird WC. Phenotypic heterogeneity of the endothelium: I. Structure, function, and mechanisms. Circ. Res. 2007;100:158–173. - PubMed
    1. Alva JA, Zovein AC, Monvoisin A, Murphy T, Salazar A, Harvey NL, Carmeliet P, Iruela-Arispe ML. VE-Cadherin-Cre-recombinase transgenic mouse: a tool for lineage analysis and gene deletion in endothelial cells. Dev. Dyn. 2006;235:759–767. - PubMed
    1. Børsum T, Hagen I, Henriksen T, Carlander B. Alterations in the protein composition and surface structure of human endothelial cells during growth in primary culture. Atherosclerosis. 1982;44:367–378. - PubMed
    1. Brauer PR, Cai DH. Expression of tissue inhibitor of metalloproteinases (TIMPs) during early cardiac development. Mech. Dev. 2002;113:175–179. - PubMed

Publication types

MeSH terms

Substances

Associated data