. 2013;9(7):e1003122.
doi: 10.1371/journal.pcbi.1003122. Epub 2013 Jul 4.

Interaction of motility, directional sensing, and polarity modules recreates the behaviors of chemotaxing cells

Affiliations

Interaction of motility, directional sensing, and polarity modules recreates the behaviors of chemotaxing cells

Changji Shi et al. PLoS Comput Biol. 2013.

Abstract

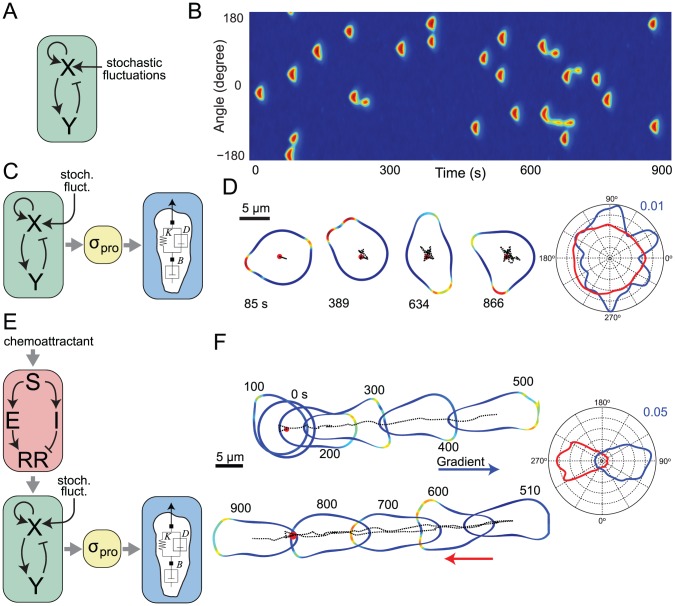
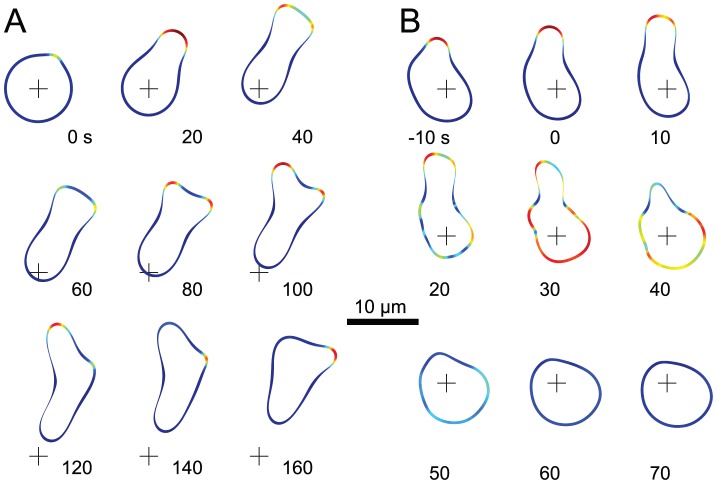
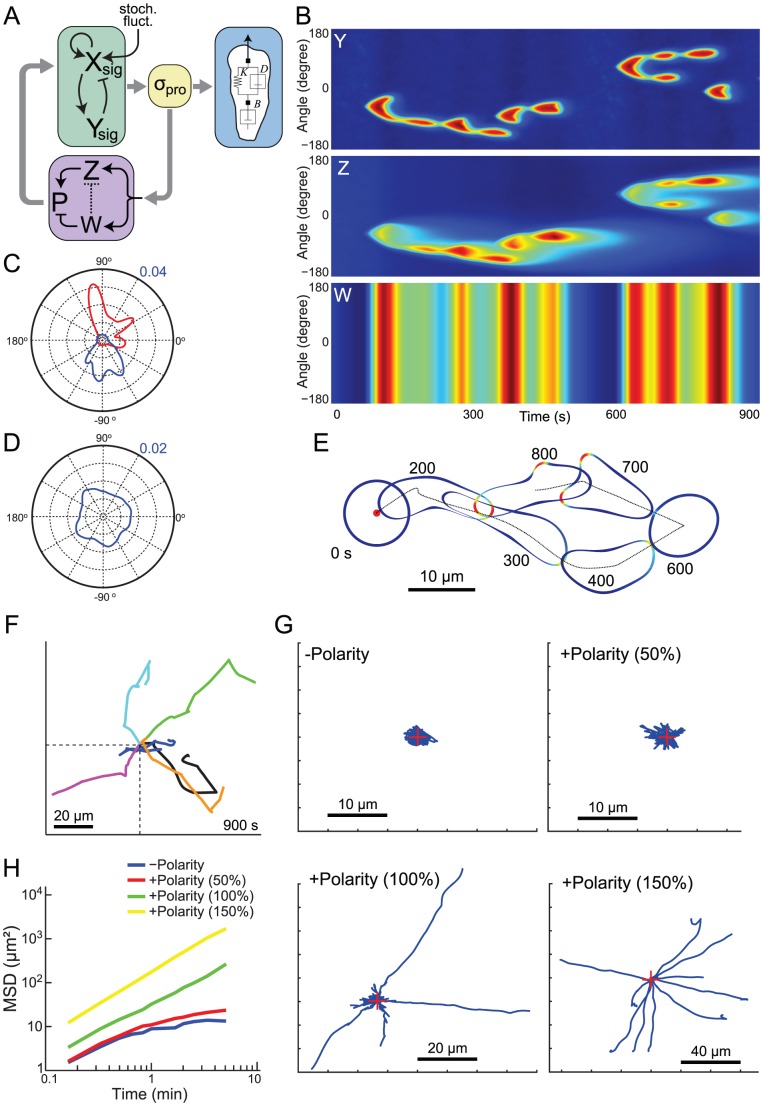
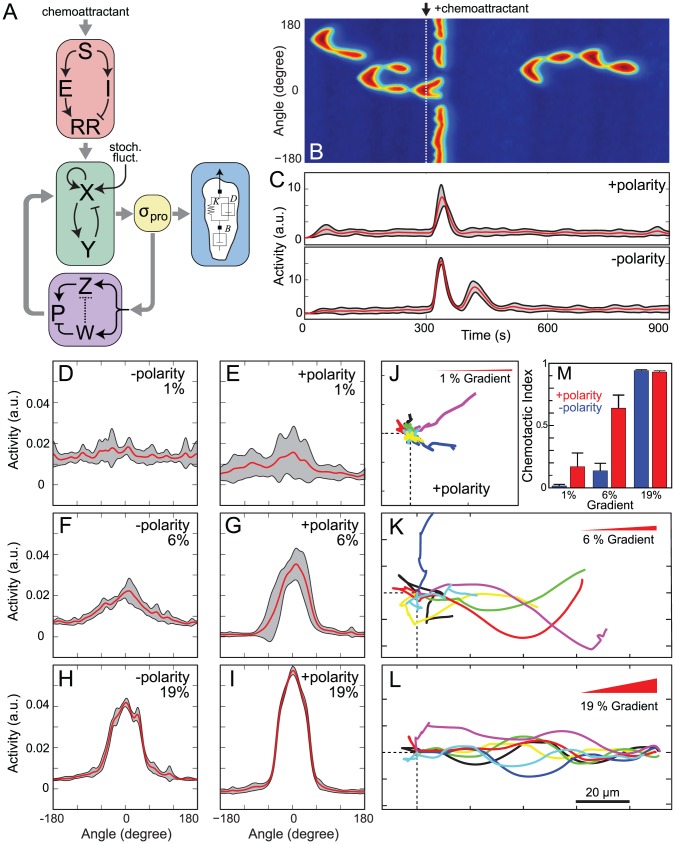
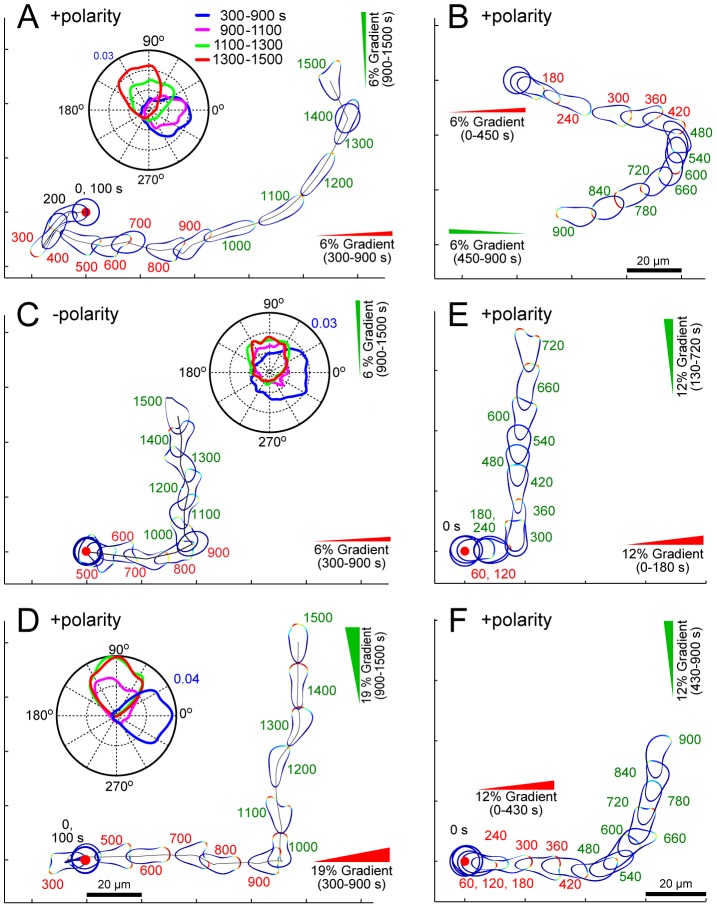
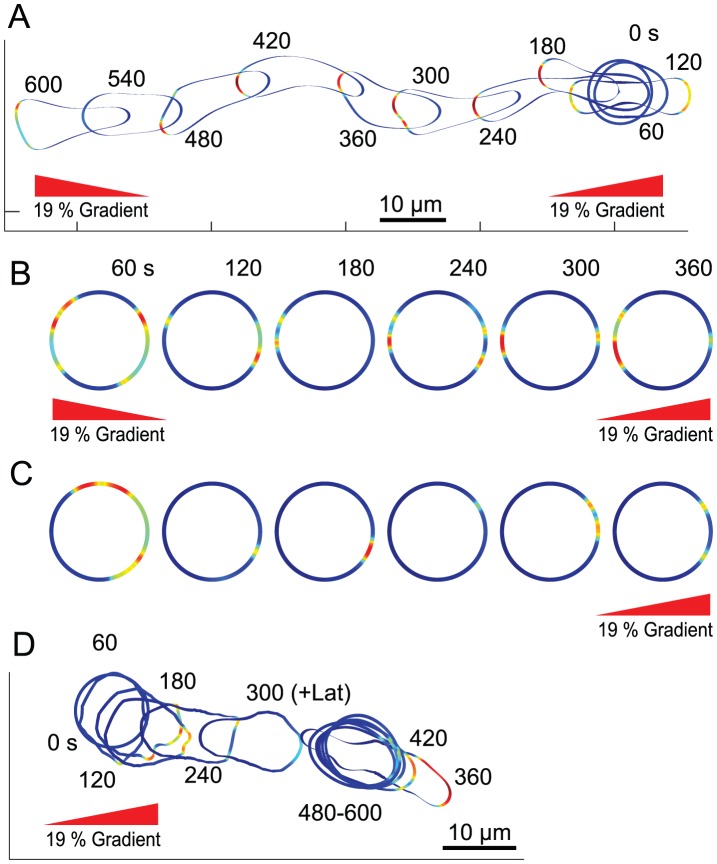
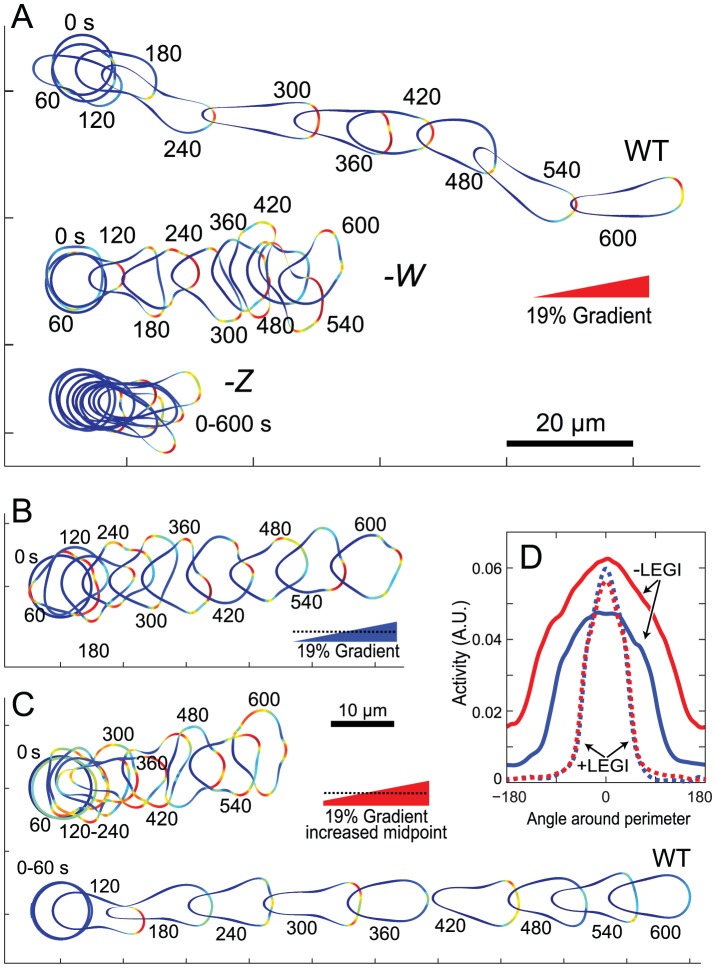
Chemotaxis involves the coordinated action of separable but interrelated processes: motility, gradient sensing, and polarization. We have hypothesized that these are mediated by separate modules that account for these processes individually and that, when combined, recreate most of the behaviors of chemotactic cells. Here, we describe a mathematical model where the modules are implemented in terms of reaction-diffusion equations. Migration and the accompanying changes in cellular morphology are demonstrated in simulations using a mechanical model of the cell cortex implemented in the level set framework. The central module is an excitable network that accounts for random migration. The response to combinations of uniform stimuli and gradients is mediated by a local excitation, global inhibition module that biases the direction in which excitability is directed. A polarization module linked to the excitable network through the cytoskeleton allows unstimulated cells to move persistently and, for cells in gradients, to gradually acquire distinct sensitivity between front and back. Finally, by varying the strengths of various feedback loops in the model we obtain cellular behaviors that mirror those of genetically altered cell lines.


Conflict of interest statement

The authors have declared that no competing interests exist.

Figures

Figure 1
Figure 1. The LEGI-biased excitable network model (LEGI-BEN).
(A) The excitable network module is implemented as an activator (X)-inhibitor (Y) system that is triggered by stochastic fluctuations. (B) Kymograph of a one-dimensional simulation in the absence of chemoattractant stimulus. The colors refer to activity of Y (plots of X show similar, though noisier, behavior) around a cell. Blue indicates low activity; red marks high activity. (C) Coupling of the excitable network to protrusive stresses (σpro). Our simulations assume that the protrusive stress is proportional to Y. The cell's mechanical behavior is described by the viscoelastic model shown. (D) Level set simulations in which protrusive stresses coincide with the location of high activity drive cellular deformations. The colors around the membrane are the same as in panel B. The dotted lines trace the trajectory of the cell centroid (starting point is the red circle). The directional history of activity for this sample simulation is shown in the radial plot on the right in blue. The red line represents the average activities of 20 simulations lasting 900 seconds (Video S1). (E) The local excitation (E)-global inhibition (I) module (LEGI) takes chemoattractant stimulus (S) and drives a response regulator (RR). Response regulator acts to bias the activity of the excitable network. (F) Level set simulations of the cell migrating in response to changing chemoattractant gradients. A gradient was applied at time 180 s at 90° and moved at time 500 to 270°. (Note that, to avoid the cell shapes being superimposed, we have moved the trajectory during the second half of the simulation below that of the first; the dotted lines show how the two halves of the trajectory overlap.) The radial plot shows the average activities in response to the two gradients. The blue line is for the time period from 0 s to 500 s; red is from 500 s to 900 s (Video S2).
Figure 2
Figure 2. Changes in morphology of motile cells.
(A) The signaling activity and corresponding cellular morphology is shown for a migrating cell in a gradient. This cell demonstrates pseudopod splitting, pseudopod retractions, and a zig-zag pattern of activity. The cross is placed for spatial reference. (B) This cell experienced a global (spatially uniform) chemoattractant stimulus at 0 s. The ensuing period of high activity (30 s) causes the cell to start rounding up; this rounding increases during the refractory period of the excitable network (70 s).
Figure 3
Figure 3. Polarized-biased excitable network in unstimulated cells.
(A) Excitable network with polarization mechanism, which consists of complementary local positive (Z) and global negative (W) feedback loops. The inhibitory term (W) can work either directly on polarity (P) or by inhibiting Z (dotted line). The latter could represent depletion. In simulations we assumed the former. (B) Simulation results of excitable network with polarity. Kymographs show the spatio-temporal distribution of Y, Z and W. (C) Analysis of activity for the simulation of panel B. The blue and red lines represent the activities (Y) along the perimeter during the periods 70–490 s and 600–850 s, respectively. (D) Average activity of 40 simulations, each 900 s long. (E) Level set simulation of unstimulated cell shows persistent movement in the absence of stimulus. (F) Centroid trajectories of six different cells during 900 s (Video S3). The asterisk denotes the trajectory of the cell from panel E (the trajectory in panel E was rotated for better presentation). (G) Centroids of unstimulated cells with varying strengths of the polarity module's contribution during 600 s simulations (n = 10 each). (H) Average mean-square displacements as a function of time for the simulations of panel G.
Figure 4
Figure 4. Response of polarized cells to external stimuli.
(A) LEGI-Biased excitable network with polarity. (B) Signaling activity (Y) around the cell in response to a spatially uniform stimulus at 300 s. (C) Average activity (red) and variance (one standard deviation) for 20 simulations. Activities are integrated around the whole cell perimeter. Top graph represents the results of the polarized, LEGI-BEN; bottom is for the model without polarity. (D–I) Radial distribution of signaling activities of the model responding to 1% (D,E) or 6% (F,G) and 19% (H,I) gradients. Panels D, F and H are for cells without the polarization module; panels E, G, and I include this module. Data are average for ten simulations of 900 s. Red lines denote mean value and black lines represent one standard deviation. (J–L) Sample trajectories of the cell centroid for level set simulations of cells incorporating the polarization module under various gradients (all pointing to the right). The dotted lines point to the starting point and lines represent individual cells' trajectories. All the simulations were run for 900 seconds. (M). Chemotactic indices for simulations of cells migrating under various gradients with or without the polarization module. Error bars denote one standard deviation based on seven simulations each.
Figure 5
Figure 5. Polarized cell's response to changes in the direction of the gradient.
(A–D) In these simulations the arrows indicate the direction of the gradient from 300–900 s (red) and from 900–1500 s (green). Cells were unstimulated from 0–300 s. The simulations differ as to the steepness of the gradient: 6% (A–C) and 19% (D), whether the polarity module is active (A, B, D) or not (C), and the direction of the second gradient: 90° (A,C,D) and 180° (B). The insets show the direction of the signaling activity relative to the cell for various time intervals. See also Videos S4, S5, S6. (E, F). These simulations show the response of a cell with all its modules (Fig. 4A) responding to a change in the direction of a 12% gradient for which the interval during which the first gradient is imposed varies from 130 s (E) to 430 s (F). See also Videos S7 and S8.
Figure 6
Figure 6. Effect of conflicting gradients.
(A, B) In these simulations, two 19% gradients were applied 180 degrees apart. Panel A shows the response of a cell with all components in Fig. 4A (Video S9); Panel B is that of a cell lacking motility and polarization (Video S11). Video S10 shows the response of a motile cell lacking the polarity module. (C) Response of an immobile cell to a single 19% gradient (Video 12). (D) Level set simulation of cell migration under gradient (applied at 0 s) with Latrunculin treatment at 300 s. The total simulation time is 600 s.
Figure 7
Figure 7. Response of cells with altered modules.
(A) Response to a chemoattractant gradient of cells with reduction in feedback strengths in W or Z by 50%, compared to WT cells (Video S13). (B, C) Response of a cell to a gradient in which the LEGI inhibitor is not regulated by receptor occupancy assuming that the midpoint in gradient concentration is changed (Videos S14 and S15). The bottom cell in panel C shows the response of a WT cell in response to the increased midpoint concentration. (D) Directional distribution of the responses from panels B (blue) and C (red) with different gradient midpoints. Dotted lines show the corresponding distributions for the model with the LEGI module.

Similar articles

Cited by

References

    1. Iglesias PA, Devreotes PN (2008) Navigating through models of chemotaxis. Curr Opin Cell Biol 20: 35–40. - PubMed
    1. Devreotes P, Janetopoulos C (2003) Eukaryotic chemotaxis: Distinctions between directional sensing and polarization. J Biol Chem 278: 20445–20448. - PubMed
    1. Onsum MD, Rao CV (2009) Calling heads from tails: The role of mathematical modeling in understanding cell polarization. Curr Opin Cell Biol 21: 74–81. - PMC - PubMed
    1. Jilkine A, Edelstein-Keshet L (2011) A comparison of mathematical models for polarization of single eukaryotic cells in response to guided cues. PLoS Comput Biol 7: e1001121. - PMC - PubMed
    1. Holmes WR, Edelstein-Keshet L (2012) A comparison of computational models for eukaryotic cell shape and motility. PLoS Comput Biol 8: e1002793. - PMC - PubMed

Publication types

LinkOut - more resources