

Tumor microenvironment profoundly modifies functional status of macrophages: peritoneal and tumor-associated macrophages are two very different subpopulations
- PMID: 23850963
- PMCID: PMC3771500
- DOI: 10.1016/j.cellimm.2013.06.008
Tumor microenvironment profoundly modifies functional status of macrophages: peritoneal and tumor-associated macrophages are two very different subpopulations
Abstract
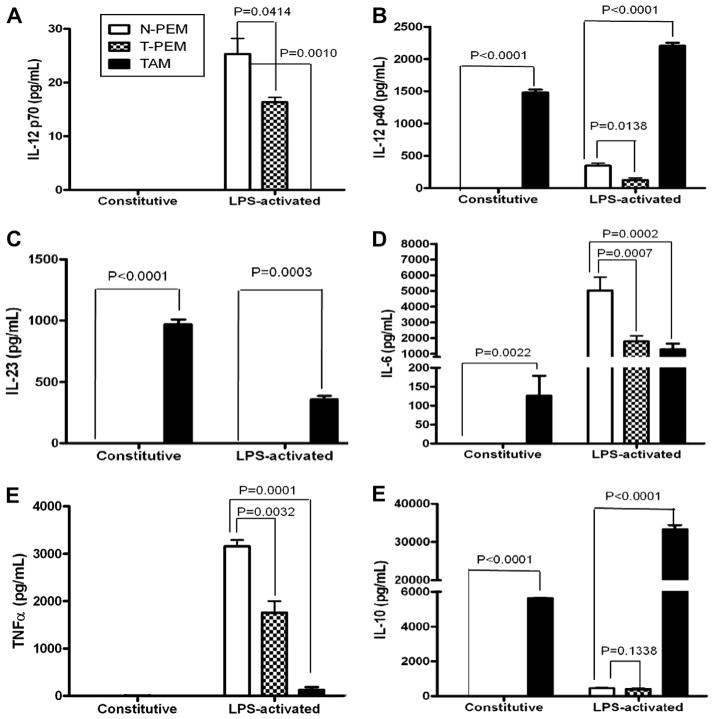
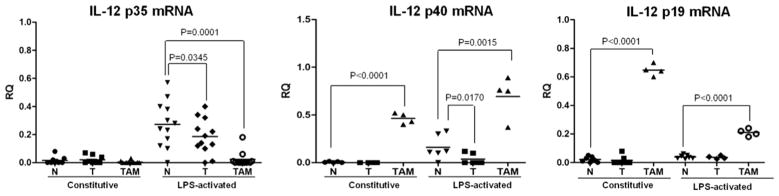
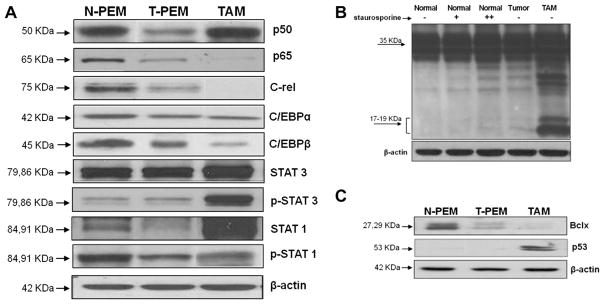
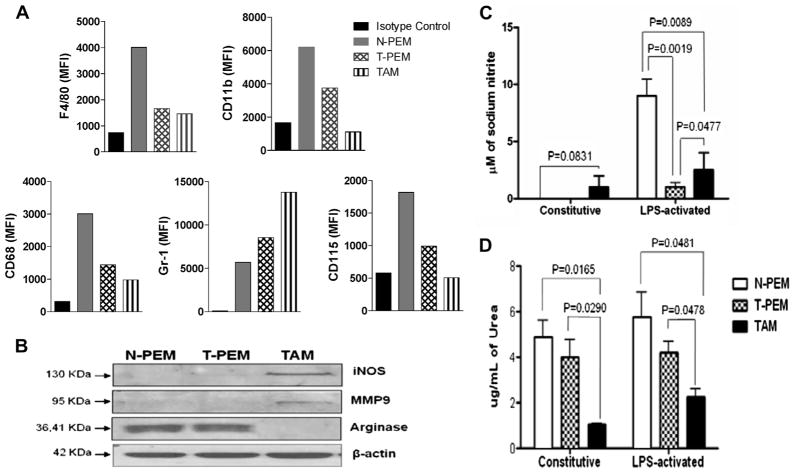
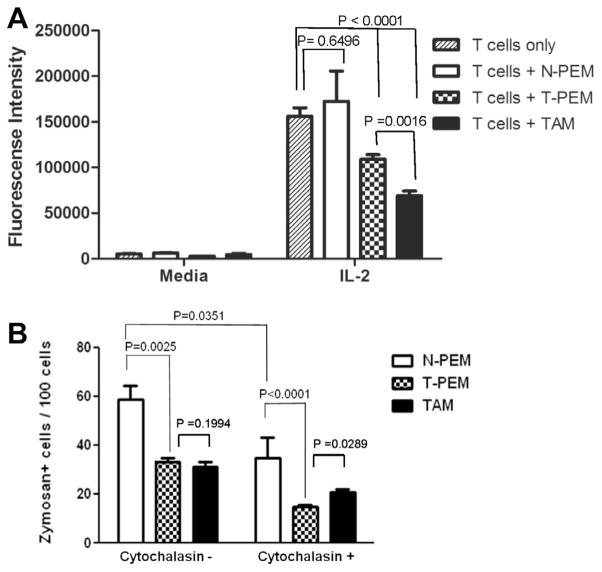
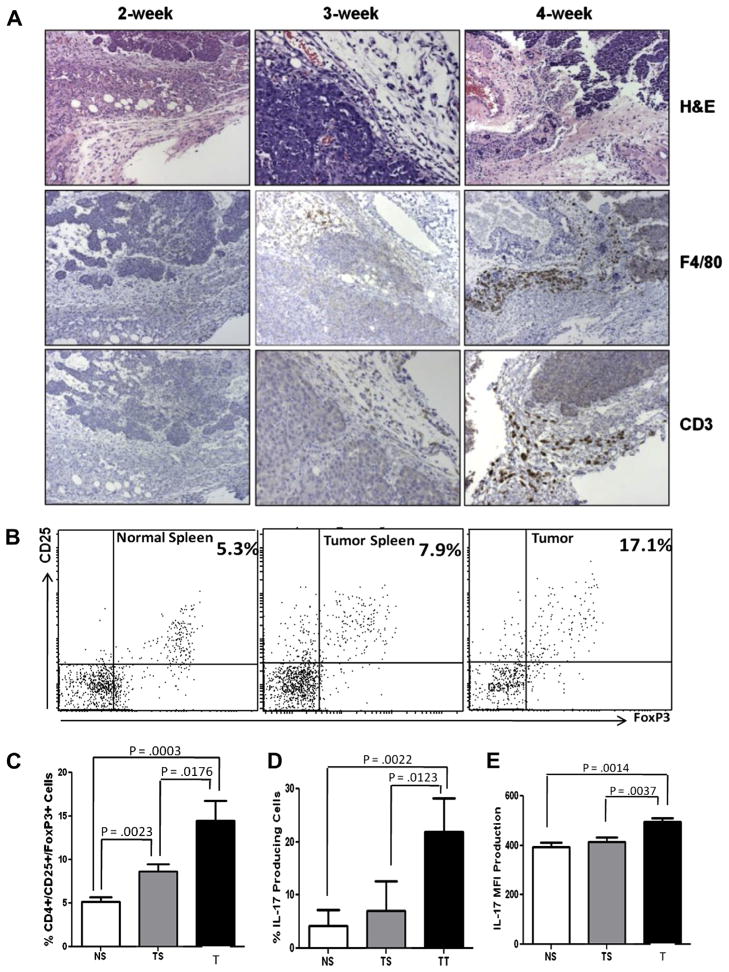
Macrophages are key players in the inflammatory response. In this study, we tested the hypothesis that although all macrophage subpopulations in tumor hosts are affected by the disease, it is the close proximity to the tumor that induces major alterations in these cells. We compared tumor-associated macrophages (TAMs) with peritoneal macrophages from mice bearing D1-DMBA-3 mammary tumors (T-PEMs). Our results show that TAMs downregulate IL-12p70 but upregulate IL-12p40, IL-23, IL-6 and IL-10. Some NFκB and C/EBP transcription factors family members are decreased in TAMs; however NFκBp50 homodimers, STAT1/pSTAT1 and STAT3/pSTAT3 are overexpressed. Furthermore, while TAMs block T-cell proliferation and are more prone to apoptosis compared to T-PEMs, both types of macrophages have an impaired phagocytic capacity. Moreover, TAMs constitutively express iNOS and produce nitric oxide but do not express arginase and are Gr-1(high) and CD11b(low). Collectively, our analysis of two spatially distinct macrophage subpopulations in tumor-bearing mice revealed that the tumor modulates them differently into two molecularly and functionally dissimilar macrophage subpopulations.
Keywords: Immunosuppression; Inflammation; MDSC; NPEM; Peritoneal and tumor-associated macrophages; TAM; TPEM; Treg; Tumor microenvironment; myeloid derived suppressor cell; normal peritoneal elicited macrophage; regulatory T cell; tumor associated macrophage; tumor peritoneal elicited macrophage.
Copyright © 2013 Elsevier Inc. All rights reserved.
Figures
Similar articles
-
IL-11-induced reduction of C/EBP transcription factor binding may contribute to the IL-12 downregulation in tumor-bearing mice.Int J Oncol. 2003 Feb;22(2):439-48. Int J Oncol. 2003. PMID: 12527946
-
Interleukin-17 and prostaglandin E2 are involved in formation of an M2 macrophage-dominant microenvironment in lung cancer.J Thorac Oncol. 2012 Jul;7(7):1091-100. doi: 10.1097/JTO.0b013e3182542752. J Thorac Oncol. 2012. PMID: 22534817 Free PMC article.
-
The altered tumoricidal capacity of macrophages isolated from tumor-bearing mice is related to reduce expression of the inducible nitric oxide synthase gene.J Exp Med. 1996 Apr 1;183(4):1323-9. doi: 10.1084/jem.183.4.1323. J Exp Med. 1996. PMID: 8666890 Free PMC article.
-
Alterations in macrophages and monocytes from tumor-bearing mice: evidence of local and systemic immune impairment.Immunol Res. 2013 Dec;57(1-3):86-98. doi: 10.1007/s12026-013-8438-3. Immunol Res. 2013. PMID: 24203436 Review.
-
Macrophage plasticity and function in cancer and pregnancy.Front Immunol. 2024 Jan 11;14:1333549. doi: 10.3389/fimmu.2023.1333549. eCollection 2023. Front Immunol. 2024. PMID: 38274812 Free PMC article. Review.
Cited by
-
Nitric Oxide Generated by Tumor-Associated Macrophages Is Responsible for Cancer Resistance to Cisplatin and Correlated With Syntaxin 4 and Acid Sphingomyelinase Inhibition.Front Immunol. 2018 May 29;9:1186. doi: 10.3389/fimmu.2018.01186. eCollection 2018. Front Immunol. 2018. PMID: 29896202 Free PMC article.
-
Advances in research on the interaction between inflammation and cancer.J Int Med Res. 2020 Apr;48(4):300060519895347. doi: 10.1177/0300060519895347. Epub 2019 Dec 29. J Int Med Res. 2020. PMID: 31885347 Free PMC article. Review.
-
CD103+ CD11b+ Dendritic Cells Induce Th17 T Cells in Muc2-Deficient Mice with Extensively Spread Colitis.PLoS One. 2015 Jun 29;10(6):e0130750. doi: 10.1371/journal.pone.0130750. eCollection 2015. PLoS One. 2015. PMID: 26121642 Free PMC article.
-
Breast cancers from black women exhibit higher numbers of immunosuppressive macrophages with proliferative activity and of crown-like structures associated with lower survival compared to non-black Latinas and Caucasians.Breast Cancer Res Treat. 2016 Jul;158(1):113-126. doi: 10.1007/s10549-016-3847-3. Epub 2016 Jun 9. Breast Cancer Res Treat. 2016. PMID: 27283835 Free PMC article.
-
Paracrine Interactions between Adipocytes and Tumor Cells Recruit and Modify Macrophages to the Mammary Tumor Microenvironment: The Role of Obesity and Inflammation in Breast Adipose Tissue.Cancers (Basel). 2015 Jan 15;7(1):143-78. doi: 10.3390/cancers7010143. Cancers (Basel). 2015. PMID: 25599228 Free PMC article.
References
-
- Witz IP. Yin-yang activities and vicious cycles in the tumor microenvironment. Cancer Res. 2008;68:9–13. - PubMed
-
- Albini A, Sporn MB. The tumour microenvironment as a target for chemoprevention. Nat Rev Cancer. 2007;7:139–147. - PubMed
-
- Balkwill F, Charles KA, Mantovani A. Smoldering and polarized inflammation in the initiation and promotion of malignant disease. Cancer Cell. 2005;7:211–217. - PubMed
-
- Mantovani A, Allavena P, Sica A, Balkwill F. Cancer-related inflammation. Nature. 2008;454:436–444. - PubMed
-
- Rodriguez-Vita J, Lawrence T. The resolution of inflammation and cancer. Cytokine Growth Factor Rev. 2010;21:61–65. - PubMed
Publication types
MeSH terms
Grants and funding
LinkOut - more resources
Full Text Sources
Other Literature Sources
Research Materials
Miscellaneous
