

Differences in the degree of cerulein-induced chronic pancreatitis in C57BL/6 mouse substrains lead to new insights in identification of potential risk factors in the development of chronic pancreatitis
- PMID: 23845568
- PMCID: PMC3763767
- DOI: 10.1016/j.ajpath.2013.05.020
Differences in the degree of cerulein-induced chronic pancreatitis in C57BL/6 mouse substrains lead to new insights in identification of potential risk factors in the development of chronic pancreatitis
Abstract
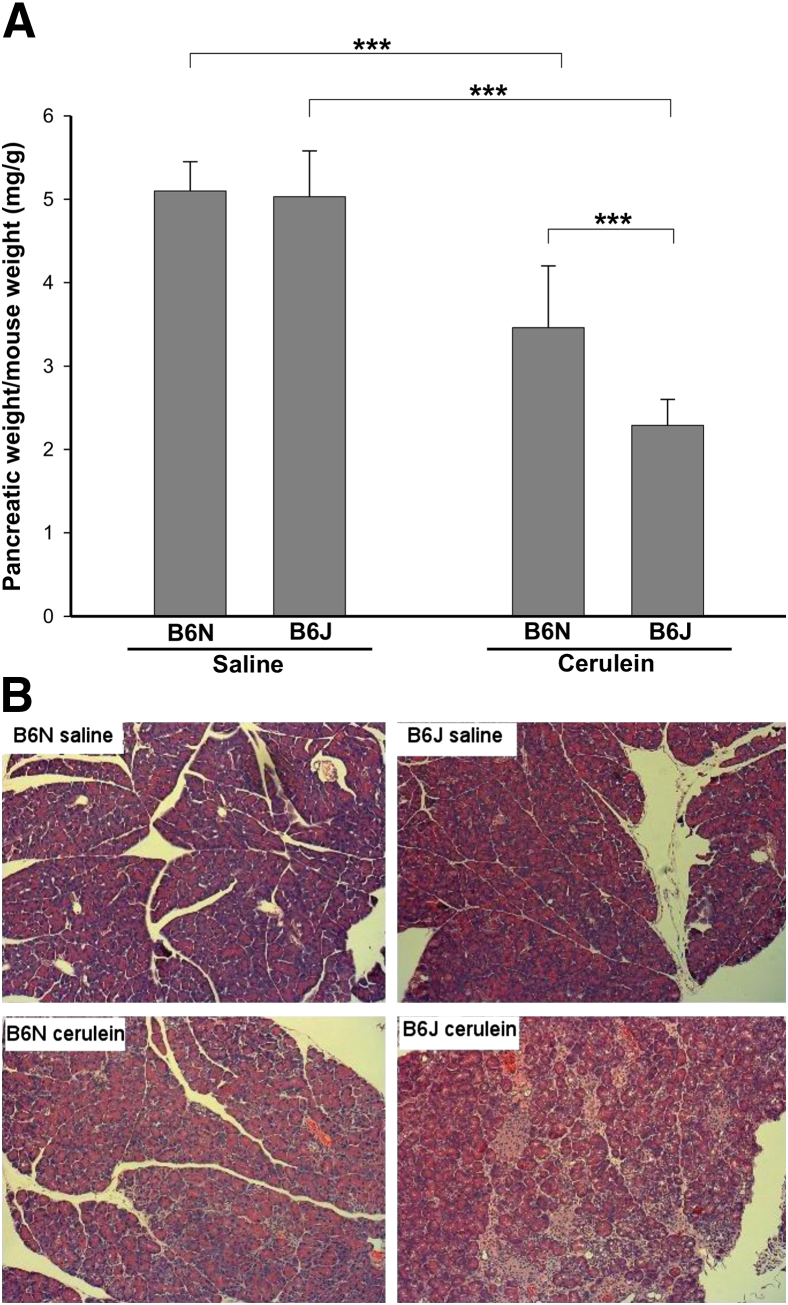
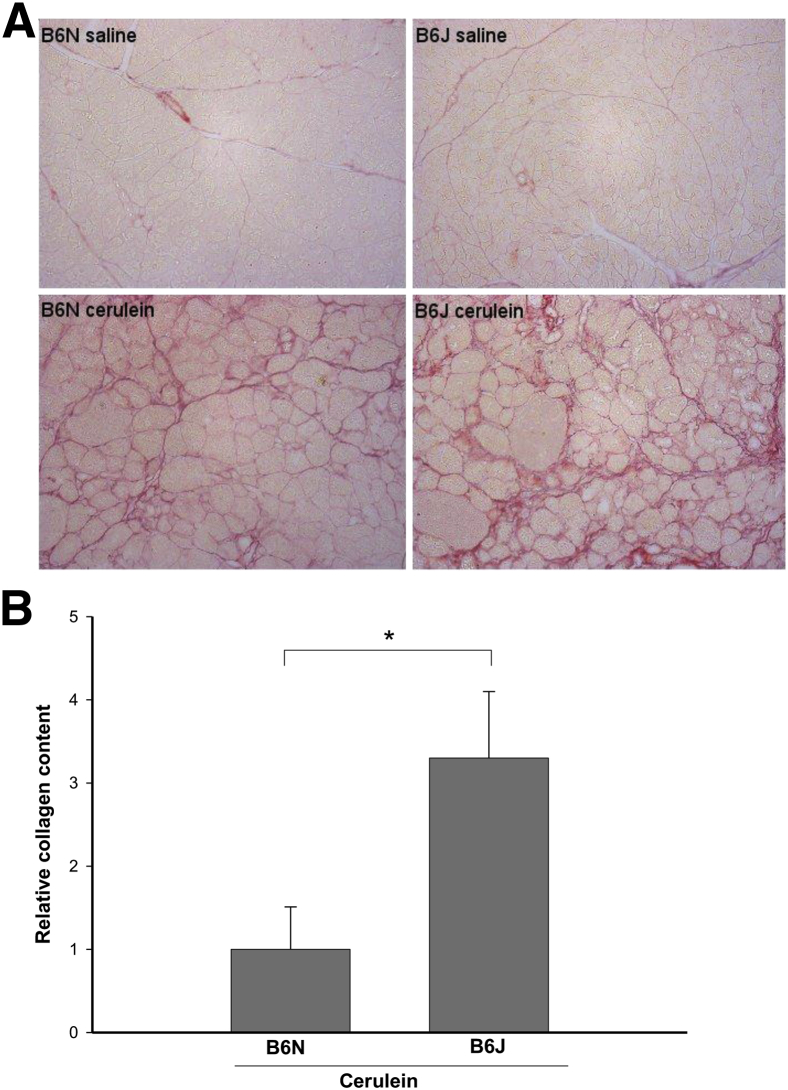
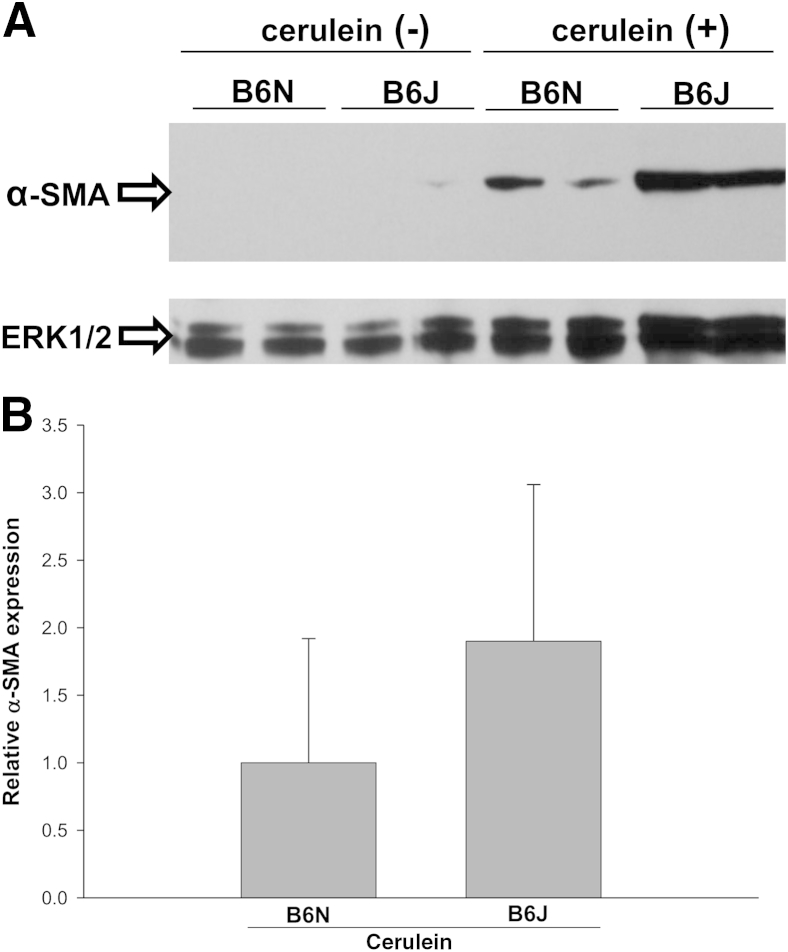
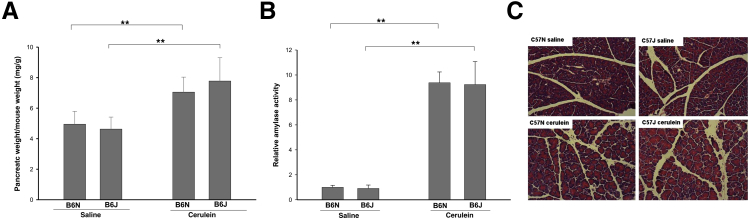
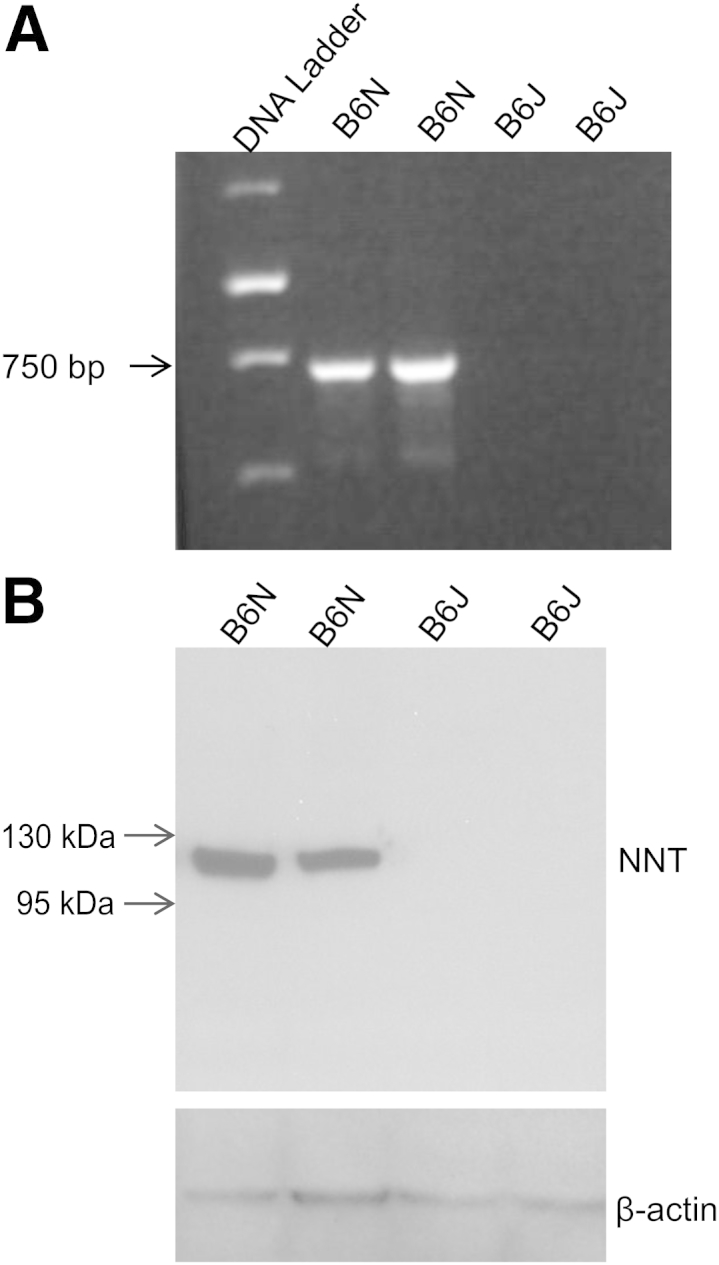
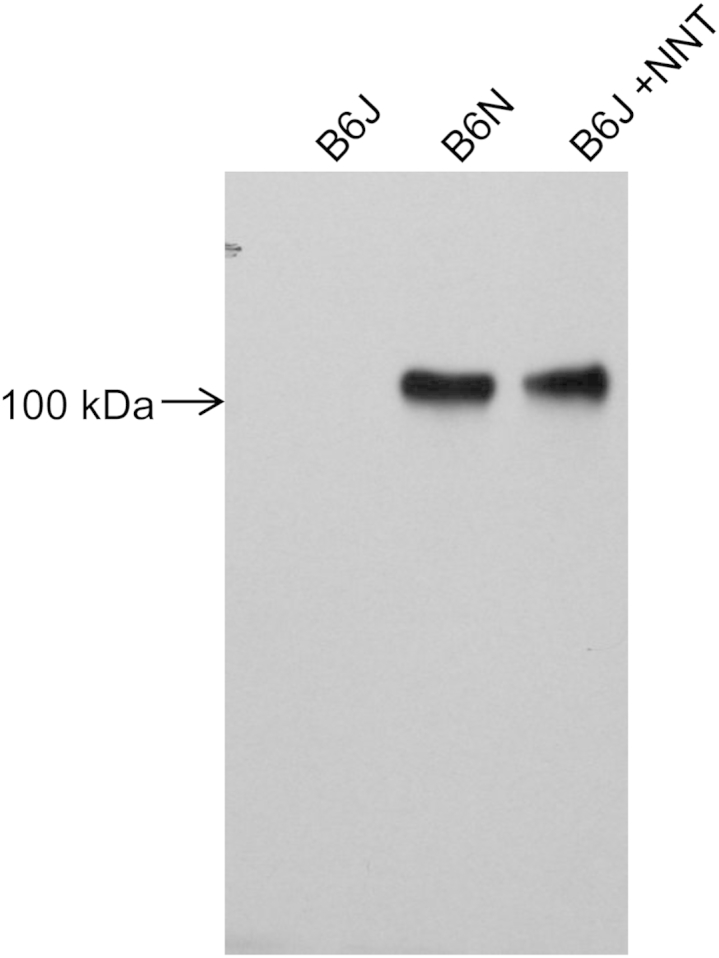
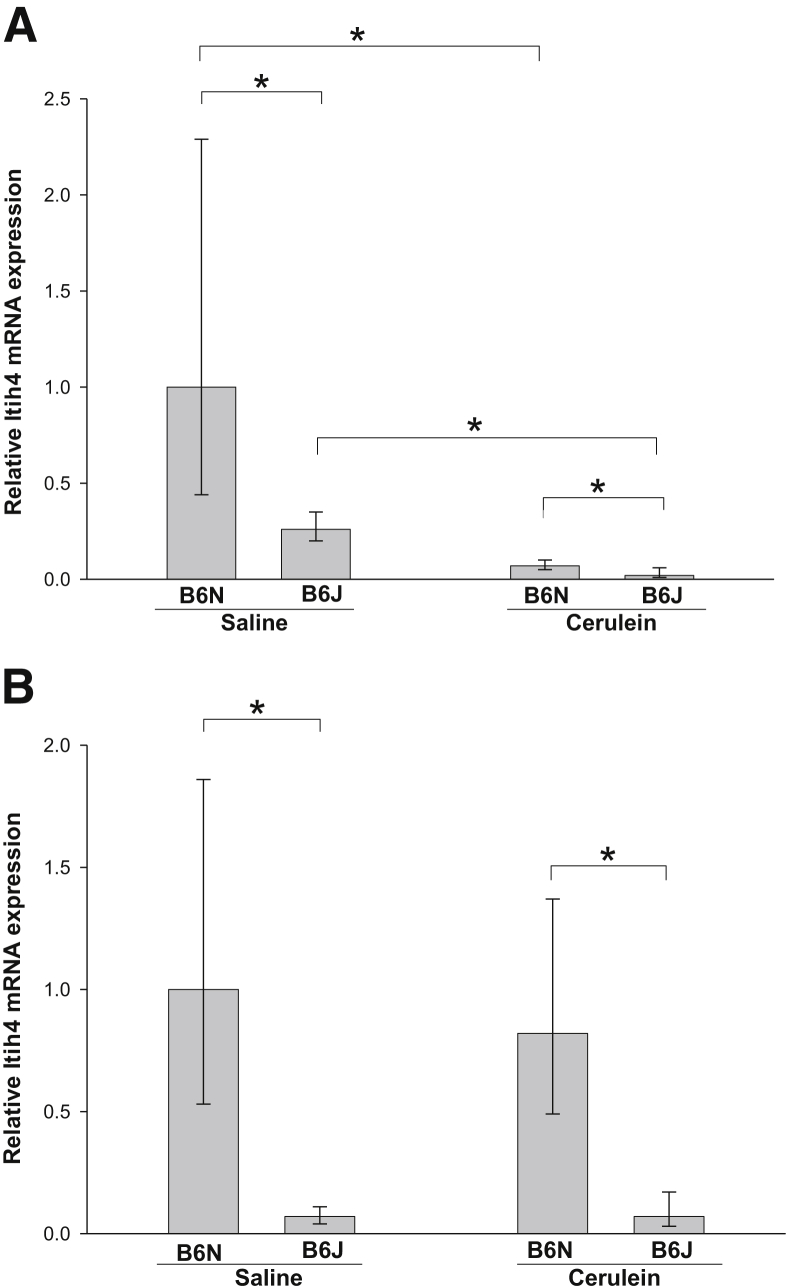
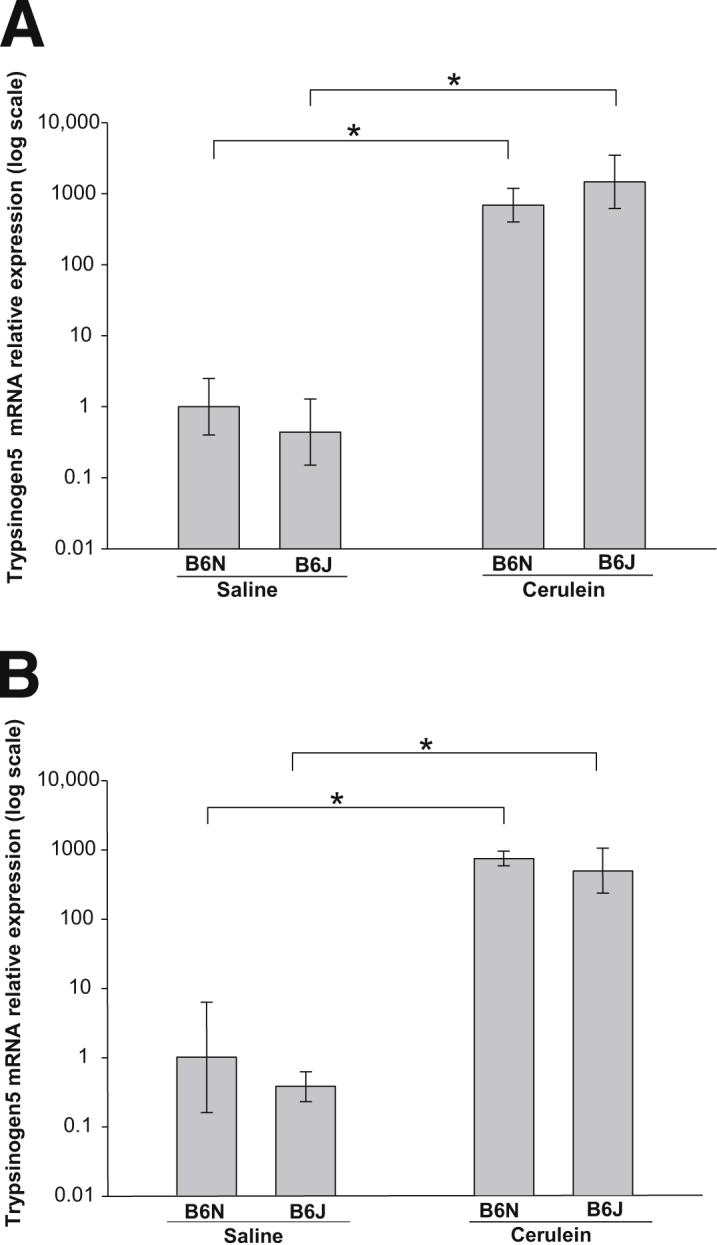
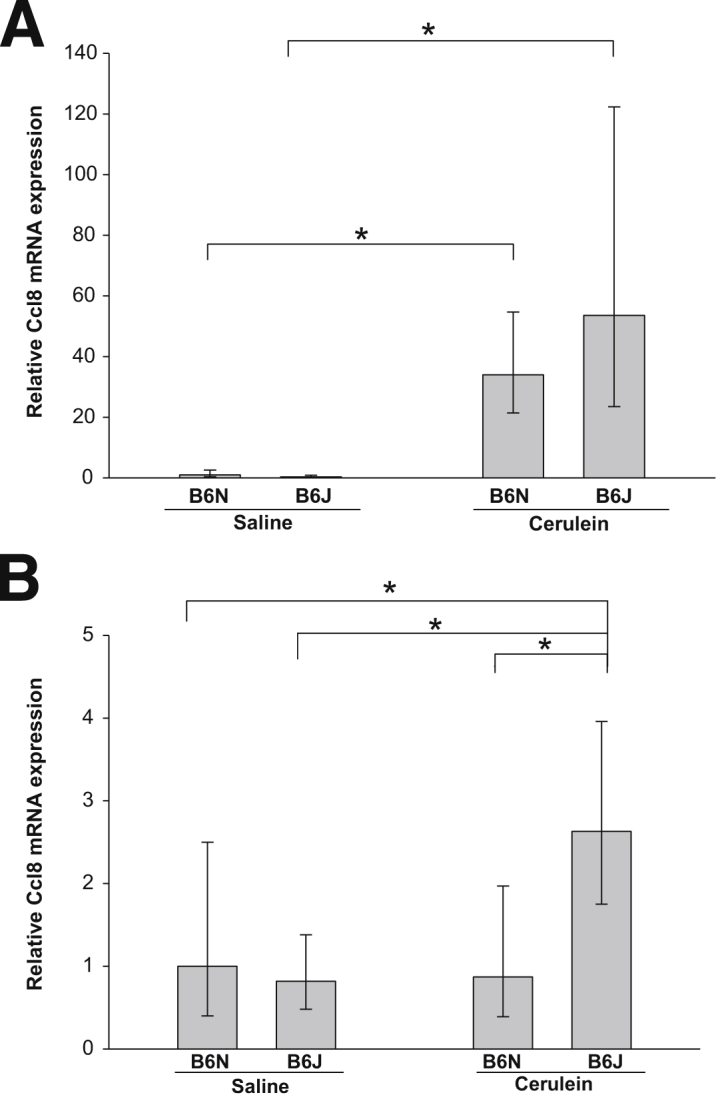
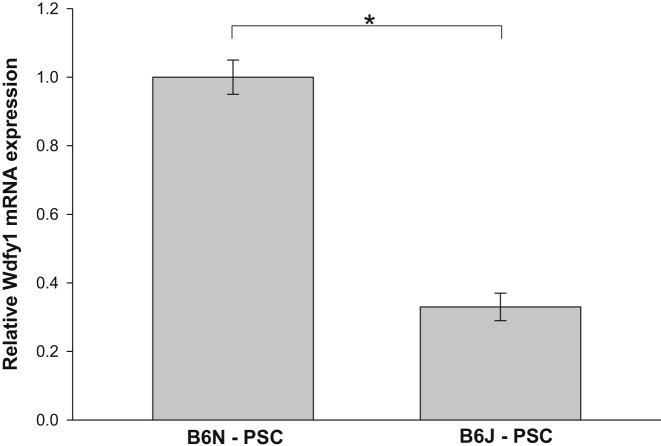
A frequently used experimental model of chronic pancreatitis (CP) recapitulating human disease is repeated injection of cerulein into mice. C57BL/6 is the most commonly used inbred mouse strain for biomedical research, but widespread demand has led to generation of several substrains with subtly different phenotypes. In this study, two common substrains, C57BL/6J and C57BL/6NHsd, exhibited different degrees of CP, with C57BL/6J being more susceptible to repetitive cerulein-induced CP as assessed by pancreatic atrophy, pancreatic morphological changes, and fibrosis. We hypothesized that the deficiency of nicotinamide nucleotide transhydrogenase (NNT) protein in C57BL/6J is responsible for the more severe C57BL/6J phenotype but the parameters of CP in NNT-expressing transgenic mice generated on a C57BL6/J background do not differ with those of wild-type C57BL/6J. The highly similar genetic backgrounds but different CP phenotypes of these two substrains presents a unique opportunity to discover genes important in pathogenesis of CP. We therefore performed whole mouse genome Affymetrix microarray analysis of pancreatic gene expression of C57BL/6J and C57BL/6NHsd before and after induction of CP. Genes with differentially regulated expression between the two substrains that might be candidates in CP progression included Mmp7, Pcolce2, Itih4, Wdfy1, and Vtn. We also identified several genes associated with development of CP in both substrains, including RIKEN cDNA 1810009J06 gene (trypsinogen 5), Ccl8, and Ccl6.
Copyright © 2013 American Society for Investigative Pathology. Published by Elsevier Inc. All rights reserved.
Figures
Similar articles
-
Cerulein-induced chronic pancreatitis does not require intra-acinar activation of trypsinogen in mice.Gastroenterology. 2013 May;144(5):1076-1085.e2. doi: 10.1053/j.gastro.2013.01.041. Epub 2013 Jan 24. Gastroenterology. 2013. PMID: 23354015 Free PMC article.
-
Gremlin is a key pro-fibrogenic factor in chronic pancreatitis.J Mol Med (Berl). 2015 Oct;93(10):1085-1093. doi: 10.1007/s00109-015-1308-9. Epub 2015 Jul 5. J Mol Med (Berl). 2015. PMID: 26141517 Free PMC article.
-
Angiotensin II signaling through the AT1a and AT1b receptors does not have a role in the development of cerulein-induced chronic pancreatitis in the mouse.Am J Physiol Gastrointest Liver Physiol. 2010 Jul;299(1):G70-80. doi: 10.1152/ajpgi.00006.2010. Epub 2010 Apr 22. Am J Physiol Gastrointest Liver Physiol. 2010. PMID: 20413721 Free PMC article.
-
A New Insight into Chronic Pancreatitis.Tohoku J Exp Med. 2019 Aug;248(4):225-238. doi: 10.1620/tjem.248.225. Tohoku J Exp Med. 2019. PMID: 31378749 Review.
-
Pancreatic Stellate Cells and the Targeted Therapeutic Strategies in Chronic Pancreatitis.Molecules. 2023 Jul 22;28(14):5586. doi: 10.3390/molecules28145586. Molecules. 2023. PMID: 37513458 Free PMC article. Review.
Cited by
-
DGA ameliorates severe acute pancreatitis through modulating macrophage pyroptosis.Inflamm Res. 2024 Oct;73(10):1803-1817. doi: 10.1007/s00011-024-01931-3. Epub 2024 Sep 5. Inflamm Res. 2024. PMID: 39231819
-
YAP1 and TAZ Control Pancreatic Cancer Initiation in Mice by Direct Up-regulation of JAK-STAT3 Signaling.Gastroenterology. 2016 Sep;151(3):526-39. doi: 10.1053/j.gastro.2016.05.006. Epub 2016 May 20. Gastroenterology. 2016. PMID: 27215660 Free PMC article.
-
Impact of a novel homozygous mutation in nicotinamide nucleotide transhydrogenase on mitochondrial DNA integrity in a case of familial glucocorticoid deficiency.BBA Clin. 2015 Jun 1;3:70-78. doi: 10.1016/j.bbacli.2014.12.003. BBA Clin. 2015. PMID: 26309815 Free PMC article.
-
What does procollagen C-endopeptidase enhancer protein 2 have to do with HDL-cholesteryl ester uptake? Or how I learned to stop worrying and love reverse cholesterol transport?Curr Opin Lipidol. 2015 Oct;26(5):420-5. doi: 10.1097/MOL.0000000000000211. Curr Opin Lipidol. 2015. PMID: 26218419 Free PMC article. Review.
-
An Inhibitor of Arginine-Glycine-Aspartate-Binding Integrins Reverses Fibrosis in a Mouse Model of Nonalcoholic Steatohepatitis.Hepatol Commun. 2018 Dec 27;3(2):246-261. doi: 10.1002/hep4.1298. eCollection 2019 Feb. Hepatol Commun. 2018. PMID: 30766962 Free PMC article.
References
-
- Witt H., Apte M.V., Keim V., Wilson J.S. Chronic pancreatitis: challenges and advances in pathogenesis, genetics, diagnosis, and therapy. Gastroenterology. 2007;132:1557–1573. - PubMed
-
- Nair R.J., Lawler L., Miller M.R. Chronic pancreatitis. Am Fam Physician. 2007;76:1679–1688. - PubMed
-
- Neuschwander-Tetri B.A., Burton F.R., Presti M.E., Britton R.S., Janney C.G., Garvin P.R., Brunt E.M., Galvin N.J., Poulos J.E. Repetitive self-limited acute pancreatitis induces pancreatic fibrogenesis in the mouse. Dig Dis Sci. 2000;45:665–674. - PubMed
Publication types
MeSH terms
Substances
Grants and funding
LinkOut - more resources
Full Text Sources
Other Literature Sources
Molecular Biology Databases
Miscellaneous
