Evaluating cell lines as tumour models by comparison of genomic profiles
- PMID: 23839242
- PMCID: PMC3715866
- DOI: 10.1038/ncomms3126
Evaluating cell lines as tumour models by comparison of genomic profiles
Abstract
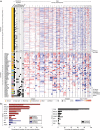
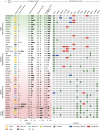
Cancer cell lines are frequently used as in vitro tumour models. Recent molecular profiles of hundreds of cell lines from The Cancer Cell Line Encyclopedia and thousands of tumour samples from the Cancer Genome Atlas now allow a systematic genomic comparison of cell lines and tumours. Here we analyse a panel of 47 ovarian cancer cell lines and identify those that have the highest genetic similarity to ovarian tumours. Our comparison of copy-number changes, mutations and mRNA expression profiles reveals pronounced differences in molecular profiles between commonly used ovarian cancer cell lines and high-grade serous ovarian cancer tumour samples. We identify several rarely used cell lines that more closely resemble cognate tumour profiles than commonly used cell lines, and we propose these lines as the most suitable models of ovarian cancer. Our results indicate that the gap between cell lines and tumours can be bridged by genomically informed choices of cell line models for all tumour types.
Figures


Similar articles
-
Molecular characterization of 7 new established cell lines from high grade serous ovarian cancer.Cancer Lett. 2015 Jul 1;362(2):218-28. doi: 10.1016/j.canlet.2015.03.040. Epub 2015 Apr 8. Cancer Lett. 2015. PMID: 25862976
-
Genetic determinants of FOXM1 overexpression in epithelial ovarian cancer and functional contribution to cell cycle progression.Oncotarget. 2015 Sep 29;6(29):27613-27. doi: 10.18632/oncotarget.4546. Oncotarget. 2015. PMID: 26243836 Free PMC article.
-
Mucins and Truncated O-Glycans Unveil Phenotypic Discrepancies between Serous Ovarian Cancer Cell Lines and Primary Tumours.Int J Mol Sci. 2018 Jul 13;19(7):2045. doi: 10.3390/ijms19072045. Int J Mol Sci. 2018. PMID: 30011875 Free PMC article.
-
POSTN/TGFBI-associated stromal signature predicts poor prognosis in serous epithelial ovarian cancer.Gynecol Oncol. 2014 Feb;132(2):334-42. doi: 10.1016/j.ygyno.2013.12.021. Epub 2013 Dec 22. Gynecol Oncol. 2014. PMID: 24368280
-
High-resolution gene copy number and expression profiling of human chromosome 22 in ovarian carcinomas.Genes Chromosomes Cancer. 2005 Mar;42(3):228-37. doi: 10.1002/gcc.20128. Genes Chromosomes Cancer. 2005. PMID: 15578687
Cited by
-
Withaferin A and Ovarian Cancer Antagonistically Regulate Skeletal Muscle Mass.Front Cell Dev Biol. 2021 Feb 25;9:636498. doi: 10.3389/fcell.2021.636498. eCollection 2021. Front Cell Dev Biol. 2021. PMID: 33718372 Free PMC article.
-
ATF6-Mediated Signaling Contributes to PARP Inhibitor Resistance in Ovarian Cancer.Mol Cancer Res. 2023 Jan 3;21(1):3-13. doi: 10.1158/1541-7786.MCR-22-0102. Mol Cancer Res. 2023. PMID: 36149636 Free PMC article.
-
Ovarian cancer-derived ascitic fluids induce a senescence-dependent pro-cancerogenic phenotype in normal peritoneal mesothelial cells.Cell Oncol (Dordr). 2016 Oct;39(5):473-481. doi: 10.1007/s13402-016-0289-1. Epub 2016 Jul 21. Cell Oncol (Dordr). 2016. PMID: 27444787
-
Elevated AKAP12 in paclitaxel-resistant serous ovarian cancer cells is prognostic and predictive of poor survival in patients.J Proteome Res. 2015 Apr 3;14(4):1900-10. doi: 10.1021/pr5012894. Epub 2015 Mar 19. J Proteome Res. 2015. PMID: 25748058 Free PMC article.
-
Chloroxine overrides DNA damage tolerance to restore platinum sensitivity in high-grade serous ovarian cancer.Cell Death Dis. 2021 Apr 14;12(4):395. doi: 10.1038/s41419-021-03665-0. Cell Death Dis. 2021. PMID: 33854036 Free PMC article.
References
-
- Stein W. D., Litman T., Fojo T. & Bates S. E. A Serial Analysis of Gene Expression (SAGE) database analysis of chemosensitivity: comparing solid tumors with cell lines and comparing solid tumors from different tissue origins. Cancer Res. 64, 2805–2816 (2004). - PubMed
Publication types
MeSH terms
Substances
Grants and funding
LinkOut - more resources
Full Text Sources
Other Literature Sources
Medical
Research Materials
Miscellaneous

