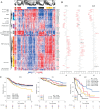
Gene expression patterns unveil a new level of molecular heterogeneity in colorectal cancer
- PMID: 23836465
- PMCID: PMC3840702
- DOI: 10.1002/path.4212
Gene expression patterns unveil a new level of molecular heterogeneity in colorectal cancer
Abstract
The recognition that colorectal cancer (CRC) is a heterogeneous disease in terms of clinical behaviour and response to therapy translates into an urgent need for robust molecular disease subclassifiers that can explain this heterogeneity beyond current parameters (MSI, KRAS, BRAF). Attempts to fill this gap are emerging. The Cancer Genome Atlas (TGCA) reported two main CRC groups, based on the incidence and spectrum of mutated genes, and another paper reported an EMT expression signature defined subgroup. We performed a prior free analysis of CRC heterogeneity on 1113 CRC gene expression profiles and confronted our findings to established molecular determinants and clinical, histopathological and survival data. Unsupervised clustering based on gene modules allowed us to distinguish at least five different gene expression CRC subtypes, which we call surface crypt-like, lower crypt-like, CIMP-H-like, mesenchymal and mixed. A gene set enrichment analysis combined with literature search of gene module members identified distinct biological motifs in different subtypes. The subtypes, which were not derived based on outcome, nonetheless showed differences in prognosis. Known gene copy number variations and mutations in key cancer-associated genes differed between subtypes, but the subtypes provided molecular information beyond that contained in these variables. Morphological features significantly differed between subtypes. The objective existence of the subtypes and their clinical and molecular characteristics were validated in an independent set of 720 CRC expression profiles. Our subtypes provide a novel perspective on the heterogeneity of CRC. The proposed subtypes should be further explored retrospectively on existing clinical trial datasets and, when sufficiently robust, be prospectively assessed for clinical relevance in terms of prognosis and treatment response predictive capacity. Original microarray data were uploaded to the ArrayExpress database (http://www.ebi.ac.uk/arrayexpress/) under Accession Nos E-MTAB-990 and E-MTAB-1026.
Keywords: colorectal cancer; gene expression; histopathology; molecular heterogeneity.
© 2013 Swiss Institute of Bioinformatics. Journal of Pathology published by John Wiley & Sons Ltd on behalf of Pathological Society of Great Britain and Ireland.
Figures


Similar articles
-
Clinicopathological features of CpG island methylator phenotype-positive colorectal cancer and its adverse prognosis in relation to KRAS/BRAF mutation.Pathol Int. 2008 Feb;58(2):104-13. doi: 10.1111/j.1440-1827.2007.02197.x. Pathol Int. 2008. PMID: 18199160
-
External validation of molecular subtype classifications of colorectal cancer based on microsatellite instability, CIMP, BRAF and KRAS.BMC Cancer. 2019 Jul 11;19(1):681. doi: 10.1186/s12885-019-5842-7. BMC Cancer. 2019. PMID: 31296182 Free PMC article.
-
Survival marker genes of colorectal cancer derived from consistent transcriptomic profiling.BMC Genomics. 2018 Dec 11;19(Suppl 8):857. doi: 10.1186/s12864-018-5193-9. BMC Genomics. 2018. PMID: 30537927 Free PMC article.
-
Four molecular subtypes of colorectal cancer and their precursor lesions.Arch Pathol Lab Med. 2011 Jun;135(6):698-703. doi: 10.5858/2010-0523-RA.1. Arch Pathol Lab Med. 2011. PMID: 21631262 Review.
-
Classification of colorectal cancer based on correlation of clinical, morphological and molecular features.Histopathology. 2007 Jan;50(1):113-30. doi: 10.1111/j.1365-2559.2006.02549.x. Histopathology. 2007. PMID: 17204026 Review.
Cited by
-
Head and neck cancer subtypes with biological and clinical relevance: Meta-analysis of gene-expression data.Oncotarget. 2015 Apr 20;6(11):9627-42. doi: 10.18632/oncotarget.3301. Oncotarget. 2015. PMID: 25821127 Free PMC article.
-
Molecular portraits of colorectal cancer morphological regions.Elife. 2023 Nov 13;12:RP86655. doi: 10.7554/eLife.86655. Elife. 2023. PMID: 37956043 Free PMC article.
-
Chromosome 20q11.21 Amplifications in Colorectal Cancer.Cancer Genomics Proteomics. 2021 May-Jun;18(3 Suppl):487-496. doi: 10.21873/cgp.20274. Cancer Genomics Proteomics. 2021. PMID: 33994370 Free PMC article.
-
AKT3 Expression in Mesenchymal Colorectal Cancer Cells Drives Growth and Is Associated with Epithelial-Mesenchymal Transition.Cancers (Basel). 2021 Feb 14;13(4):801. doi: 10.3390/cancers13040801. Cancers (Basel). 2021. PMID: 33673003 Free PMC article.
-
Improved survival among colon cancer patients with increased differentially expressed pathways.BMC Med. 2015 Apr 8;13:75. doi: 10.1186/s12916-015-0292-9. BMC Med. 2015. PMID: 25890236 Free PMC article.
References
-
- Bosman FT. WHO Classification of Tumours of the Digestive System. 4th edn. Lyons: 2010. World Health Organization, International Agency for Research on Cancer. International Agency for Research on Cancer (IARC)
-
- Tejpar S, Saridaki Z, Delorenzi M, et al. Microsatellite instability, prognosis and drug sensitivity of stage II and III colorectal cancer: more complexity to the puzzle. J Natl Cancer Inst. 2011;103:841–844. - PubMed
-
- Vecchione L, Jacobs B, Normanno N, et al. EGFR-targeted therapy. Exp Cell Res. 2011;317:2765–2771. - PubMed
-
- Martini M, Vecchione L, Siena S, et al. Targeted therapies: how personal should we go? Nat Rev Clin Oncol. 2011;9:87–97. - PubMed
Publication types
MeSH terms
Substances
LinkOut - more resources
Full Text Sources
Other Literature Sources
Medical
Molecular Biology Databases
Research Materials
Miscellaneous

