Review
. 2013:29:241-70.
doi: 10.1146/annurev-cellbio-101512-122317. Epub 2013 Jul 5.

Something silent this way forms: the functional organization of the repressive nuclear compartment

Affiliations
Review

Something silent this way forms: the functional organization of the repressive nuclear compartment

Joan C Ritland Politz et al. Annu Rev Cell Dev Biol. 2013.

Abstract

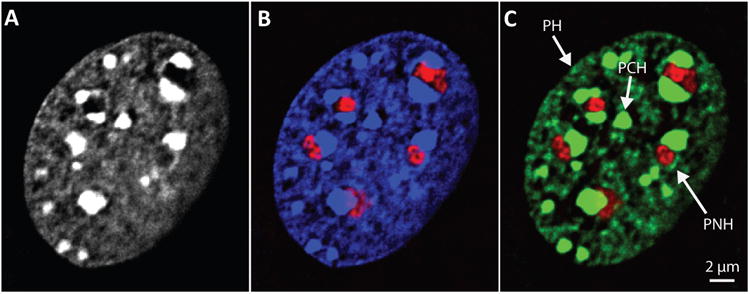
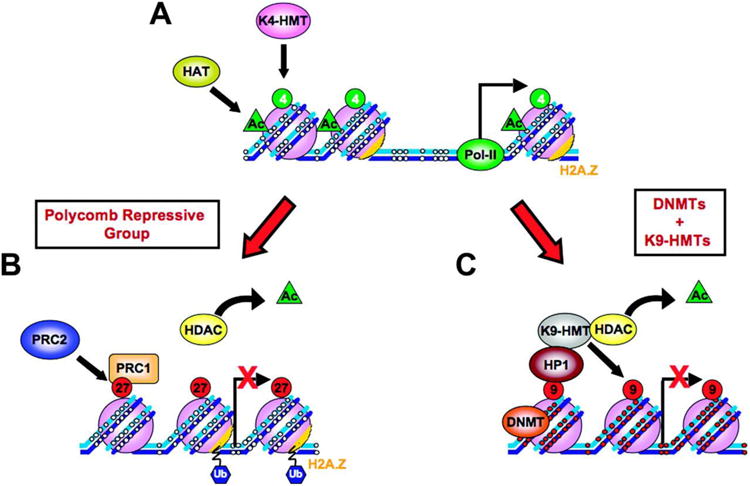
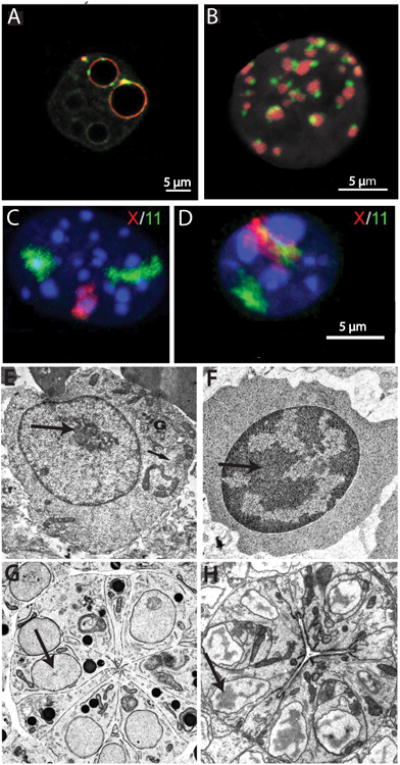
The repressive compartment of the nucleus is comprised primarily of telomeric and centromeric regions, the silent portion of ribosomal RNA genes, the majority of transposable element repeats, and facultatively repressed genes specific to different cell types. This compartment localizes into three main regions: the peripheral heterochromatin, perinucleolar heterochromatin, and pericentromeric heterochromatin. Both chromatin remodeling proteins and transcription of noncoding RNAs are involved in maintenance of repression in these compartments. Global reorganization of the repressive compartment occurs at each cell division, during early development, and during terminal differentiation. Differential action of chromatin remodeling complexes and boundary element looping activities are involved in mediating these organizational changes. We discuss the evidence that heterochromatin formation and compartmentalization may drive nuclear organization.


Figures

Figure 1
Figure 1
Heterochromatin distribution in a mammalian cell. Murine embryonic fibroblast stained with (a) DAPI, (b) DAPI (blue) plus antibodies to fibrillarin (red) to mark nucleoli, and (c) antibodies to H3K9me3 (green) and fibrillarin (red). Abbreviations: PCH, pericentromeric heterochromatin; PH, peripheral heterochromatin; PNH, perinucleolar heterochromatin. Images are central planes from deconvolved 3D image stacks and are contrast enhanced to allow clear visualization of PH. Images from authors' laboratory.
Figure 2
Figure 2
Examples of repression in mammals. (a) An active chromatin structure and (b,c) examples of facultatively and constitutively repressed chromatin, respectively. (a) Unmethylated (small white circles) DNA (blue strands) wound around nucleosomes (purple balls) at an active DNA promoter region with RNA polymerase II (Pol II) bound at the nucleosome-free transcription start site. Active histone marks: acetylation (green triangle), H3K4 methylation (green circles), and high levels of H2A.Z on nucleosomes (orange). (b) Silencing via Polycomb repressive group proteins. PRC2 methylation of H3K27 (red circles, 27) is accompanied by deacetylation by histone deacetylase (HDAC, yellow oval), loss of H3K4 methylation, chromatin compaction, nucleosome occupancy at the transcription start site (red X indicates block to transcription), and PRC1 ubiquitinylation (blue hexagons, Ub) of H2A.Z. (c) Long-term silencing. Repressive H3K9 methylation (large red circles, 9, on purple nucleosome balls) at promoter regions recruits heterochromatin protein 1 (HP1) and leads to silencing and chromatin compaction. DNA methylation at CpG sites (small red circles on blue DNA strands) is mediated by DNA methyltransferase (DNMT). DNA-methylated promoters show a depletion of H2A.Z, loss of H3K4 methylation, and histone deacetylation. In some cases, binding of DNMT is mediated by histone H1 (not shown) (Yang et al. 2013). Abbreviations: HAT, histone acetyltransferase; K4-HMT, histone H3 lysine 4 histone methyltransferase; K9-HMT, histone H3 lysine 9 histone methyltransferase; PRC1/2, polycomb repressive complex 1/2. Modified from Sharma et al. (2010) Carcinogenesis 31:27—36, with permission from Oxford University Press.
Figure 3
Figure 3
Boundary elements and looping. (a) Diagram depicting potential chromatin-loop organization by SATB1. (top) Chromatin containing BUR (base-unpairing region) binding sites (red stars), exons from upregulated genes (orange and green boxes), downregulated genes (blue boxes), and genes that do not respond to SATB1 (gray boxes). (bottom) Proposed structure of SATB1 (turquoise ovals) binding to BURs at both upregulated and downregulated genes. SATB1 recruits histone acetylase p300 (dark blue oval) to activated gene loci and histone deacetylase HDAC1 (green oval) to repressed gene loci. From Kohwi-Shigematsu et al. (2012) with permission from Elsevier Ltd. (b) Model of chromatin loops (gold) anchored by gypsy insulator complexes (colored balls) clustered at the periphery in Drosophila nucleus. From Gerasimova et al. (2000) with permission from Elsevier Ltd. (c) Model depicting the role of the locus control region (LCR) in the localization of the chromosome territory (CT) containing the β-globin locus. (left) Wild-type β-globin locus on human chromosome 11 that has been transferred into murine erythroleukemia (MEL) cells looped from its CT (CT11, dark orange) into the interchromosomal space (yellow). A 1 megabase region is looped along with the locus, and dashed lines represent unknown locations of chromatin linking the locus with the CT. (middle) The ΔLCR β-globin locus and the surrounding region remain restricted to the CT11 surface. (right) In the presence of the IgH LCR, the locus loops to the repressive pericentromeric heterochromatin (PCH) of an endogenous murine CT (green). Light-green and hatched regions represent nuclear periphery and lamina, respectively. Abbreviation: wt, wild type. From Ragoczy et al. (2003) with permission from Springer Verlag.
Figure 4
Figure 4
Changes in heterochromatin distribution during development. (a) Single confocal section of mouse preimplantation embryo at early 2-cell and (b) 16-cell stage showing distribution of pericentromeric (red) and centromeric (green) chromatin. DNA is gray. Reprinted from Aguirre-Lavin et al. (2012). (c) Maximum-intensity 3D projections of mouse primary myoblast and (d) myotube showing DNA distribution (blue) and locations of chromosomes X (red) and 11 (green). Reprinted from Mayer et al. (2005). (e-h) Electron micrographs showing change in heterochromatin distribution (arrows) during differentiation. (e) Murine proerythroblast and (f) late erythroblast. Reprinted from Francastel et al. (2000) Nat. Rev. Mol. Cell Biol. 1: 137—43, with permission from Nature Publishing Group. Caenorhabditis elegans pharyngeal primordium in embryo (g) at the commitment stage and (h) in late embryogenesis after terminal differentiation. Reprinted from Leung et al. (1999) with permission from Elsevier Ltd.
Figure 5
Figure 5
Reorganization of heterochromatin in rod cells. (Top row) In situ hybridization showing progression of heterochromatin internalization during terminal differentiation in rod cells. Numbers indicate days after differentiation begins, with the rightmost image number indicating months. Heterochromatin (red), euchromatin (green), and chromocenters (blue) are shown. (Bottom row) Model depicting possible organization of euchromatin and heterochromatin before and after differentiation. Light gray regions represent nuclear heterochromatin and white regions, nuclear euchromatin. Adapted from Solovei et al. (2009) with permission from Elsevier Ltd.
Figure 6
Figure 6
Modeling the genome of budding yeast in 3D. (a) Population-based analysis of Saccharomyces cerevisiae genome organization. (Top panels) Structural representation of nuclear architecture (left), chromosomes as flexible chromatin fibers (center), and the scoring function quantifying the accordance of genome structure with nuclear landmark constraints (right). (Middle panels) An optimization and sampling method that minimizes the scoring function to generate a population of genome structures that satisfies landmark constraints. (Bottom panels) Statistical analysis and comparison of structural features from the population of 3D genome structures with all the experimental data. Figure reprinted from Tjong et al. (2012). Abbreviations: NE, nuclear envelope; SPB, spindle pole body. (b) Empirical model based on genome-wide, chromosome conformation capture--based data and known heterochromatic tethering sites. Each color represents a different chromosome. From Duan et al. (2010) with permission from Nature Publishing Group.

Similar articles

Cited by

References

    1. Aguirre-Lavin T, Adenot P, Bonnet-Garnier A, Lehmann G, Fleurot R, et al. 3D-FISH analysis of embryonic nuclei in mouse highlights several abrupt changes of nuclear organization during preimplantation development. BMC Dev Biol. 2012;12:30. - PMC - PubMed
    1. Ahmed K, Dehghani H, Rugg-Gunn P, Fussner E, Rossant J, Bazett-Jones DP. Global chromatin architecture reflects pluripotency and lineage commitment in the early mouse embryo. PLoS ONE. 2010;5:e10531. - PMC - PubMed
    1. Alexander RP, Fang G, Rozowsky J, Snyder M, Gerstein MB. Annotating non-coding regions of the genome. Nat Rev Genet. 2010;11:559–71. - PubMed
    1. Aravin AA, Hannon GJ. Small RNA silencing pathways in germ and stem cells. Cold Spring Harb Symp Quant Biol. 2008;73:283–90. - PubMed
    1. Bailey JA, Eichler EE. Primate segmental duplications: crucibles of evolution, diversity and disease. Nat Rev Genet. 2006;7:552–64. - PubMed

Publication types

Substances

LinkOut - more resources