. 2013 Sep;87(17):9911-22.
doi: 10.1128/JVI.01175-13. Epub 2013 Jul 3.

Increased acid stability of the hemagglutinin protein enhances H5N1 influenza virus growth in the upper respiratory tract but is insufficient for transmission in ferrets

Affiliations

Increased acid stability of the hemagglutinin protein enhances H5N1 influenza virus growth in the upper respiratory tract but is insufficient for transmission in ferrets

Hassan Zaraket et al. J Virol. 2013 Sep.

Abstract

Influenza virus entry is mediated by the acidic-pH-induced activation of hemagglutinin (HA) protein. Here, we investigated how a decrease in the HA activation pH (an increase in acid stability) influences the properties of highly pathogenic H5N1 influenza virus in mammalian hosts. We generated isogenic A/Vietnam/1203/2004 (H5N1) (VN1203) viruses containing either wild-type HA protein (activation pH 6.0) or an HA2-K58I point mutation (K to I at position 58) (activation pH 5.5). The VN1203-HA2-K58I virus had replication kinetics similar to those of wild-type VN1203 in MDCK and normal human bronchial epithelial cells and yet had reduced growth in human alveolar A549 cells, which were found to have a higher endosomal pH than MDCK cells. Wild-type and HA2-K58I viruses promoted similar levels of morbidity and mortality in C57BL/6J mice and ferrets, and neither virus transmitted efficiently to naive contact cage-mate ferrets. The acid-stabilizing HA2-K58I mutation, which diminishes H5N1 replication and transmission in ducks, increased the virus load in the ferret nasal cavity early during infection while simultaneously reducing the virus load in the lungs. Overall, a single, acid-stabilizing mutation was found to enhance the growth of an H5N1 influenza virus in the mammalian upper respiratory tract, and yet it was insufficient to enable contact transmission in ferrets in the absence of additional mutations that confer α(2,6) receptor binding specificity and remove a critical N-linked glycosylation site. The information provided here on the contribution of HA acid stability to H5N1 influenza virus fitness and transmissibility in mammals in the background of a non-laboratory-adapted virus provides essential information for the surveillance and assessment of the pandemic potential of currently circulating H5N1 viruses.


Figures

Fig 1
Fig 1
Characterization of the WT and HA2-K58I HA proteins. (A) Western blot of HA expression. Values above the HA2 band express the mean percentage of HA cleavage ± standard deviation, estimated by dividing the HA2 band intensity by that of the total HA (i.e., HA0 + HA2). (B) HA surface expression as measured by flow cytometry. (C) Binding avidities of cell surface-expressed HA protein to chicken (cRBCs) or turkey (tRBCs) red blood cells, measured as the amount of hemoglobin released following lysis of bound RBCs. (D) Binding of WT or K58I virus to either an α(2,3) or α(2,6) sialylglycopolymer. O.D. (450 nm), optical density at 450 nm. Error bars show standard deviations.
Fig 2
Fig 2
Acid stabilities of the HA proteins. (A) Micrographs of syncytium formation due to HA protein activation at various pH points in Vero cells. The arrowheads indicate syncytia. (B and C) Quantification of the HA protein conformational change at indicated pH points by using conformation-specific monoclonal antibody (VN04-16) and flow cytometry. MFI, mean fluorescence intensity. (D) Activation pHs of the HA proteins expressed as the average of the pH of syncytium formation and the pH at which 50% conformational change occurs. (E) Residual titers upon treatment of WT or HA2-K58I virus with the indicated pH buffers. Asterisks indicate P values of <0.05 using two-way ANOVA. Error bars show standard deviations.
Fig 3
Fig 3
In vitro replication kinetics of rg-VN1203 wild-type (WT) and mutant viruses. MDCK (A), A549 (B), or NHBE (C) cells were infected with rg-VN1203 WT or HA2-K58I virus at an MOI of 0.01 PFU/cell. Virus titers were determined at the indicated time points in MDCK cells by using TCID50 assays. The detection limit was 1 log10 TCID50/ml. Graphs are representative of two independent experiments. Statistical analysis was performed by using two-way ANOVA. Asterisks indicate P values of <0.01. Error bars show standard deviations.
Fig 4
Fig 4
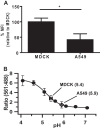
Endosomal acidification of MDCK and A549 cells. (A) pH-sensitive pHrodo dextran was used to compare the endosomal acidity of MDCK and A549 cells. Following uptake of the dye, cells were analyzed using flow cytometry to measure the intensity of pHrodo fluorescence. Data are expressed as the percentage of mean fluorescence intensity (MFI) relative to that of the MDCK cells. A higher fluorescence intensity of pHrodo correlates with a lower pH value. (B) Determination of the endosomal pH of MDCK (bowtie) and A549 (open diamond) cells. Cells were incubated with fluorescein-TMR double-conjugated dextran to allow uptake of the dye into the endosomes and then were washed and imaged by using confocal microscopy. Measurements of pH were done by using in situ calibration of fluorescein emission (closed circles) as a function of clamped endosomal pH. Clamping of endosomal pH was attained by using potassium ionophores as previously described (56). The average red (TMR, 561 nm)/green (fluorescein, 488 nm) intensities were obtained from six fields per cell line. The endosomal pH values of MDCK and A549 cells indicated on the curve were obtained by interpolation. Error bars represent standard deviations.
Fig 5
Fig 5
Effect of the K58I mutation on virulence and virus growth in C57BL/6J mice following inoculation with a large volume. (A and B) Mean percentages of weight change (A) and survival (B) of C57BL/6J mice (n = 15) following intranasal inoculation with 50 μl PBS containing 1 MLD50 of the WT or HA2-K58I viruses. The control (PBS) group was inoculated with 50 μl PBS only. Error bars show standard deviations. (C) Replication of the rg-VN1203 WT and HA2-K58I viruses in different mouse tissues. Tissues were harvested from mice (n = 10) on day 4 following infection with 1 MLD50/50 μl, and the EID50/ml titers were determined in 10-day-old embryonated chicken eggs. The detection limit was 1 log10 EID50/ml. Horizontal lines within groups show mean values. Statistical analysis was performed by using two-way ANOVA for comparison of weight loss and virus titers and the log-rank chi-square test for survival curves. Asterisks indicate P values of <0.01.
Fig 6
Fig 6
Effect of the HA2-K58I mutation on virulence and virus growth in C57BL/6J mice following inoculation with a small volume. (A and B) Mean percentages of weight change (A) and survival (B) of C57BL/6J mice (n = 5) following inoculation with a small volume (5 μl) of PBS containing 1 MLD50 of the rg-VN1203 WT or HA2-K58I virus. The control (PBS) group was inoculated with 5 μl PBS only. Error bars show standard deviations. (C) Replication of WT and HA2-K58I viruses in different mouse tissues. Tissues were harvested from mice (n = 10) on day 4 following infection with 1 MLD50/5 μl, and the EID50/ml titers were determined in 10-day-old embryonated chicken eggs. The detection limit was 1 log10 EID50/ml. Horizontal lines within groups show mean values. Statistical analysis was performed by using two-way ANOVA for comparison of weight loss and virus titers and the log-rank chi-square test for survival curves. *, P < 0.05; **, P < 0.01.
Fig 7
Fig 7
Effects of the K58I mutation on virulence, replication, and contact transmission of H5N1 influenza virus in ferrets. (A and B) Ferrets (n = 5) were inoculated with 0.5 ml PBS containing 103 TCID50 of the WT or HA2-K58I viruses. Two of the 5 directly inoculated ferrets and all contact ferrets (n = 4) were observed for (A) weight loss and (B) survival. (C) Virus replication in the nasal cavities. Nasal washes were collected from all ferrets on the indicated days until death or termination of the experiment. On day 5, 3 of the 5 directly inoculated ferrets were euthanized to collect tissues, and on days 5 and 6, one ferret each from the WT and the HA2-K58I group, respectively, died from illness. (D) Replication of the WT and HA2-K58I viruses in different body tissues on day 5 after infection. The detection limit was 1 log10 TCID50/ml. Closed symbols indicate directly inoculated ferrets. Open symbols indicate contact ferrets. NC, nasal cavities; T, trachea; LU, left lung's upper lobe; LL, left lung's lower lobe; RU, right lung's upper lobe; RM, right lung's middle lobe; RL, right lung's lower lobe; B, brain; L, liver; LI, large intestine. Horizontal lines within groups show mean values. Statistical analysis was performed by using two-way ANOVA for comparison of weight loss and virus titers and the log-rank chi-square test for survival curves. The differences in the titers of WT and HA2-K58I viruses in the left lower lung were statistically significant (P < 0.01). Statistical analyses could not be performed to compare WT and K58I groups in tissues where no K58I was detected, including the liver and right upper, middle, and lower lung.
Fig 8
Fig 8
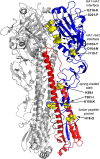
Structure of the H5N1 HA protein, identifying the locations of acid stabilizing mutations. In this crystal structure of the H5N1 HA protein (PDB 3S11), two protomers are colored gray. In the third protomer, residues in the HA1 subunit are colored blue, residues in HA2 are red, and the hydrophobic fusion peptide in HA2 is black. Amino acid residues for which acid stabilizing mutations have been discovered are presented as yellow spheres. The mutations are listed to the right of the molecule, along with the four structural regions that contain the mutations (denoted by italics). H3 numbering is used, and subscripts denote HA1 (1) and HA2 (2) subunits.

Similar articles

Cited by

References

    1. Jagger BW, Wise HM, Kash JC, Walters KA, Wills NM, Xiao YL, Dunfee RL, Schwartzman LM, Ozinsky A, Bell GL, Dalton RM, Lo A, Efstathiou S, Atkins JF, Firth AE, Taubenberger JK, Digard P. 2012. An overlapping protein-coding region in influenza A virus segment 3 modulates the host response. Science 337:199–204 - PMC - PubMed
    1. Muramoto Y, Noda T, Kawakami E, Akkina R, Kawaoka Y. 2013. Identification of novel influenza A virus proteins translated from PA mRNA. J. Virol. 87:2455–2462 - PMC - PubMed
    1. Nelson MI, Holmes EC. 2007. The evolution of epidemic influenza. Nat. Rev. Genet. 8:196–205 - PubMed
    1. Selman M, Dankar S, Forbes N, Jia JJ, Brown EG. 2012. Adaptive mutation in influenza A virus non-structural gene is linked to host switching and induces a novel protein by alternative splicing. Emerg. Microbes Infect. 1:e42.10.1038/emi.2012.38 - DOI - PMC - PubMed
    1. Webster RG, Bean WJ, Gorman OT, Chambers TM, Kawaoka Y. 1992. Evolution and ecology of influenza A viruses. Microbiol. Rev. 56:152–179 - PMC - PubMed

Publication types

MeSH terms

Substances