

Interrogating differences in expression of targeted gene sets to predict breast cancer outcome
- PMID: 23819905
- PMCID: PMC3707751
- DOI: 10.1186/1471-2407-13-326
Interrogating differences in expression of targeted gene sets to predict breast cancer outcome
Abstract
Background: Genomics provides opportunities to develop precise tests for diagnostics, therapy selection and monitoring. From analyses of our studies and those of published results, 32 candidate genes were identified, whose expression appears related to clinical outcome of breast cancer. Expression of these genes was validated by qPCR and correlated with clinical follow-up to identify a gene subset for development of a prognostic test.
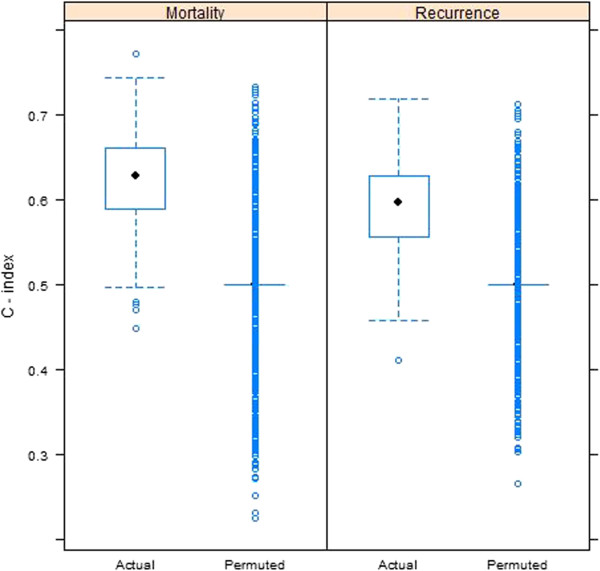
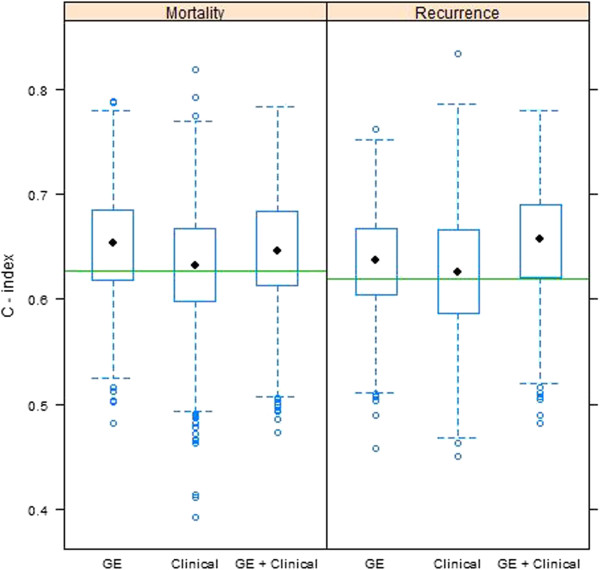
Methods: RNA was isolated from 225 frozen invasive ductal carcinomas,and qRT-PCR was performed. Univariate hazard ratios and 95% confidence intervals for breast cancer mortality and recurrence were calculated for each of the 32 candidate genes. A multivariable gene expression model for predicting each outcome was determined using the LASSO, with 1000 splits of the data into training and testing sets to determine predictive accuracy based on the C-index. Models with gene expression data were compared to models with standard clinical covariates and models with both gene expression and clinical covariates.
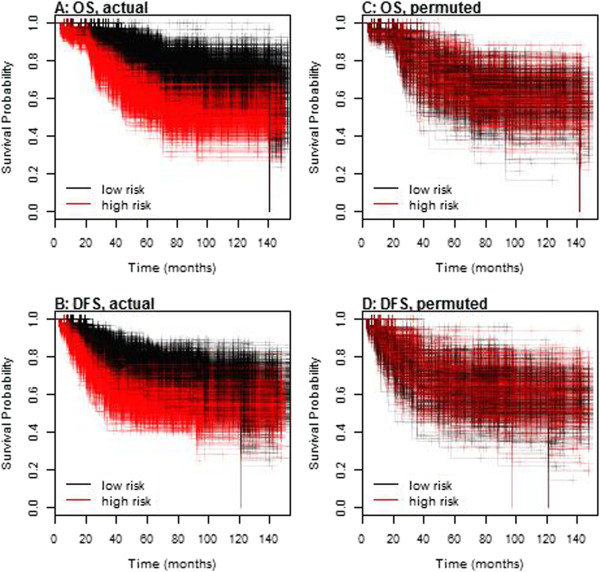
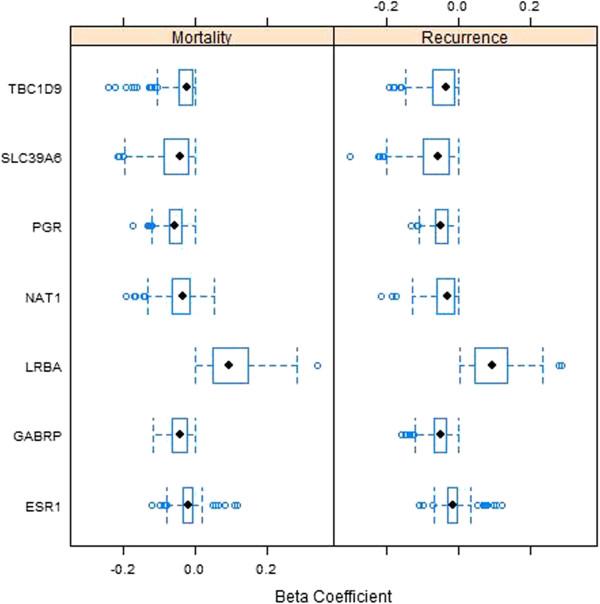
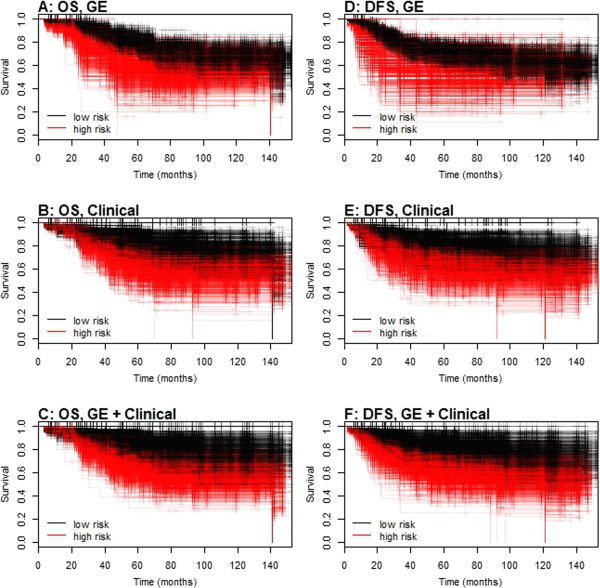
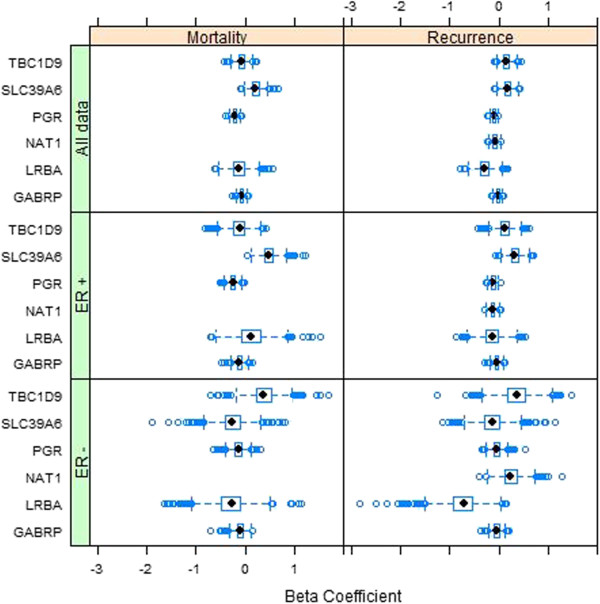
Results: Univariate analyses revealed over-expression of RABEP1, PGR, NAT1, PTP4A2, SLC39A6, ESR1, EVL, TBC1D9, FUT8, and SCUBE2 were all associated with reduced time to disease-related mortality (HR between 0.8 and 0.91, adjusted p < 0.05), while RABEP1, PGR, SLC39A6, and FUT8 were also associated with reduced recurrence times. Multivariable analyses using the LASSO revealed PGR, ESR1, NAT1, GABRP, TBC1D9, SLC39A6, and LRBA to be the most important predictors for both disease mortality and recurrence. Median C-indexes on test data sets for the gene expression, clinical, and combined models were 0.65, 0.63, and 0.65 for disease mortality and 0.64, 0.63, and 0.66 for disease recurrence, respectively.
Conclusions: Molecular signatures consisting of five genes (PGR, GABRP, TBC1D9, SLC39A6 and LRBA) for disease mortality and of six genes (PGR, ESR1, GABRP, TBC1D9, SLC39A6 and LRBA) for disease recurrence were identified. These signatures were as effective as standard clinical parameters in predicting recurrence/mortality, and when combined, offered some improvement relative to clinical information alone for disease recurrence (median difference in C-values of 0.03, 95% CI of -0.08 to 0.13). Collectively, results suggest that these genes form the basis for a clinical laboratory test to predict clinical outcome of breast cancer.
Figures
Similar articles
-
Co-expression of genes with estrogen receptor-α and progesterone receptor in human breast carcinoma tissue.Horm Mol Biol Clin Investig. 2012 Dec;12(1):377-90. doi: 10.1515/hmbci-2012-0025. Horm Mol Biol Clin Investig. 2012. PMID: 25436697
-
A Novel 18-Marker Panel Predicting Clinical Outcome in Breast Cancer.Cancer Epidemiol Biomarkers Prev. 2017 Nov;26(11):1619-1628. doi: 10.1158/1055-9965.EPI-17-0606. Epub 2017 Sep 6. Cancer Epidemiol Biomarkers Prev. 2017. PMID: 28877888
-
High levels of γ-glutamyl hydrolase (GGH) are associated with poor prognosis and unfavorable clinical outcomes in invasive breast cancer.BMC Cancer. 2013 Feb 1;13:47. doi: 10.1186/1471-2407-13-47. BMC Cancer. 2013. PMID: 23374458 Free PMC article.
-
The prognostic value of long noncoding RNA HOTTIP on clinical outcomes in breast cancer.Oncotarget. 2017 Jan 24;8(4):6833-6844. doi: 10.18632/oncotarget.14304. Oncotarget. 2017. PMID: 28036281 Free PMC article. Review.
-
The value of multigene predictors of clinical outcome in breast cancer: an analysis of the evidence.Expert Rev Mol Diagn. 2015 Feb;15(2):277-86. doi: 10.1586/14737159.2015.983476. Epub 2014 Dec 5. Expert Rev Mol Diagn. 2015. PMID: 25479414 Free PMC article. Review.
Cited by
-
Population variability of rhesus macaque (Macaca mulatta) NAT1 gene for arylamine N-acetyltransferase 1: Functional effects and comparison with human.Sci Rep. 2019 Jul 29;9(1):10937. doi: 10.1038/s41598-019-47485-x. Sci Rep. 2019. PMID: 31358821 Free PMC article.
-
Computing molecular signatures as optima of a bi-objective function: method and application to prediction in oncogenomics.Cancer Inform. 2015 Apr 19;14:33-45. doi: 10.4137/CIN.S21111. eCollection 2015. Cancer Inform. 2015. PMID: 25983540 Free PMC article.
-
High-sensitivity pattern discovery in large, paired multiomic datasets.Bioinformatics. 2022 Jun 24;38(Suppl 1):i378-i385. doi: 10.1093/bioinformatics/btac232. Bioinformatics. 2022. PMID: 35758795 Free PMC article.
-
Oestrogen-regulated protein SLC39A6: a biomarker of good prognosis in luminal breast cancer.Breast Cancer Res Treat. 2021 Oct;189(3):621-630. doi: 10.1007/s10549-021-06336-y. Epub 2021 Aug 28. Breast Cancer Res Treat. 2021. PMID: 34453638 Free PMC article.
-
The Discovery of Novel Biomarkers Improves Breast Cancer Intrinsic Subtype Prediction and Reconciles the Labels in the METABRIC Data Set.PLoS One. 2015 Jul 1;10(7):e0129711. doi: 10.1371/journal.pone.0129711. eCollection 2015. PLoS One. 2015. PMID: 26132585 Free PMC article.
References
-
- Wittliff JL, Kunitake ST, Chu SS, Travis JC. Applications of laser capture microdissection in genomics and proteomics. J Clin Ligand Assay. 2000;23:66.
-
- Wittliff JL, Erlander MG. Laser capture microdissection and its applications in genomics and proteomics. Methods Enzymol. 2002;356:12–25. - PubMed
Publication types
MeSH terms
Substances
LinkOut - more resources
Full Text Sources
Other Literature Sources
Medical
Research Materials
Miscellaneous
