. 2013 Sep;33(17):3439-60.
doi: 10.1128/MCB.00217-13. Epub 2013 Jul 1.

Sestrin 2 and AMPK connect hyperglycemia to Nox4-dependent endothelial nitric oxide synthase uncoupling and matrix protein expression

Affiliations

Sestrin 2 and AMPK connect hyperglycemia to Nox4-dependent endothelial nitric oxide synthase uncoupling and matrix protein expression

Assaad A Eid et al. Mol Cell Biol. 2013 Sep.

Abstract

Mesangial matrix accumulation is an early feature of glomerular pathology in diabetes. Oxidative stress plays a critical role in hyperglycemia-induced glomerular injury. Here, we demonstrate that, in glomerular mesangial cells (MCs), endothelial nitric oxide synthase (eNOS) is uncoupled upon exposure to high glucose (HG), with enhanced generation of reactive oxygen species (ROS) and decreased production of nitric oxide. Peroxynitrite mediates the effects of HG on eNOS dysfunction. HG upregulates Nox4 protein, and inhibition of Nox4 abrogates the increase in ROS and peroxynitrite generation, as well as the eNOS uncoupling triggered by HG, demonstrating that Nox4 functions upstream from eNOS. Importantly, this pathway contributes to HG-induced MC fibronectin accumulation. Nox4-mediated eNOS dysfunction was confirmed in glomeruli of a rat model of type 1 diabetes. Sestrin 2-dependent AMP-activated protein kinase (AMPK) activation attenuates HG-induced MC fibronectin synthesis through blockade of Nox4-dependent ROS and peroxynitrite generation, with subsequent eNOS uncoupling. We also find that HG negatively regulates sestrin 2 and AMPK, thereby promoting Nox4-mediated eNOS dysfunction and increased fibronectin. These data identify a protective function for sestrin 2/AMPK and potential targets for intervention to prevent fibrotic injury in diabetes.


Figures
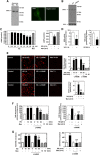
Fig 1
Fig 1
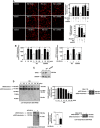
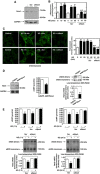
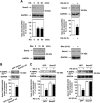
NOS is uncoupled upon stimulation with HG and contributes to HG-induced superoxide generation in MCs. (A) Left, immunoblot detection using anti-eNOS antibodies shows a 130- to 145-kDa band corresponding to the predicted molecular mass of the enzyme in glomerular ECs and MCs. Right, immunofluorescence confocal microscopy using eNOS antibody and fluorescein isothiocyanate (FITC)-linked secondary antibodies showing eNOS distribution in MCs. (B) MCs were untransfected (−) and transfected with control nontargeting siRNA (Scr; 100 nM) or with siRNA for eNOS (sieNOS; 100 nM), and eNOS protein expression was determined by Western blotting. Transfection of MCs with sieNOS but not Scr reduced the 130- to 145-kDa band. (C) Treatment of serum-deprived rat MCs with HG for short (left) or prolonged (right) time periods caused decreases in cGMP synthesis, an indicator of NO bioactivity. Mannitol (Man) (20 mM mannitol plus 5 mM d-glucose) was used as an osmotic control. Values are the means ± SE of three independent experiments. *, P < 0.05 versus control; **, P < 0.01 versus control. (D) Treatment of serum-deprived rat MCs with HG for 1 h or 24 h caused decreased NOS activity. NOS activity was measured in MC lysate by monitoring the formation of l-[14C]citrulline from l-[14C]arginine. Activity is expressed as pmol citrulline/min/mg protein. Values are the means ± SE of three independent experiments. **, P < 0.01 versus control. (E, F, and G) Serum-deprived MCs were preincubated with the NOS inhibitor L-NAME (100 μM, 3 h) before treatment with 25 mM HG for 10 min, 1 h, or 24 h. Mannitol (Man) (20 mM mannitol plus 5 mM d-glucose) was used as osmotic control. Superoxide generation was evaluated using DHE (10 μM, 30 min) and confocal microscopy (E), DHE and a multiwell fluorescence plate reader (F), or DHE and HPLC (G) as described in Materials and Methods. (E) Right, relative levels of DHE fluorescence (arbitrary units) were semiquantified. Values are the means ± SE from three independent experiments. **, P < 0.01 versus control; ##, P < 0.01 versus HG.
Fig 2
Fig 2
Uncoupled eNOS contributes to HG-induced superoxide generation in MCs. (A and B) MCs were untransfected or transfected with nontargeting siRNA (Scr) or eNOS siRNA (sieNOS) and exposed to 25 mM glucose (HG) for 10 min, 1 h, or 24 h. Superoxide generation was evaluated using DHE (10 μM, 30 min) and confocal microscopy (A) or DHE and a multiwell fluorescence plate reader (B) as described in Materials and Methods. (A) Right, relative levels of DHE fluorescence (arbitrary units) were semiquantified. Values are the means ± SE from three independent experiments. **, P < 0.01 versus control; ##, P < 0.01 versus HG in untransfected cells. (C) MCs were untransfected (−) or transfected with nontargeting siRNA (Scr) or siRNA for eNOS (sieNOS). eNOS protein knockdown with sieNOS but not Scr was confirmed by Western blotting. (D) HG decreased the eNOS dimer-to-monomer ratio, a reflection of the disruption of eNOS dimer stability and eNOS uncoupling. Serum-deprived MCs were exposed to 25 mM glucose (HG) for the indicated times, and samples were subjected to low-temperature SDS-PAGE. Mannitol (Man) (20 mM mannitol plus 5 mM d-glucose) was used as osmotic control. The Western blots shown are representative of at least three independent experiments. Middle panels show ratios of the intensities of eNOS dimer bands quantified by densitometry factored by the densitometric measurements of eNOS monomer bands. Values are the means ± SE from three independent experiments. **, P < 0.01 versus control.
Fig 3
Fig 3
Uncoupled eNOS contributes to HG-induced fibronectin accumulation in MCs. (A) Serum-deprived MCs were exposed to HG (25 mM) for 12, 24, and 48 h, and fibronectin accumulation was evaluated by direct immunoblotting of cell lysates. Glyceraldehyde-3-phosphate dehydrogenase (GAPDH) was used as loading control, and mannitol (Man) (20 mM mannitol plus 5 mM d-glucose) as osmotic control. (B and C) Serum-deprived MCs were preincubated with the NOS inhibitor L-NAME (100 μM, 3 h) before treatment with HG (25 mM) for 24 h, and fibronectin deposition was evaluated by direct immunoblotting of cell lysates (B) or by immunofluorescence with confocal microscopy (C). (D and E) MCs were untransfected or transfected with 100 nM nontargeting siRNA (Scr) or eNOS siRNA (sieNOS) and exposed or not to HG (25 mM) for 24 h. Fibronectin protein expression was determined by direct immunoblotting of cell lysates (D) or by immunofluorescence and confocal microscopy (E). (B and D) Right, histograms represent the ratios of the intensities of fibronectin bands quantified by densitometry factored by the densitometric measurements of GAPDH bands. The data are expressed as percentages of the control (untreated or untransfected cells), where the ratio in the control was defined as 100%. Values are the means ± SE from three independent experiments. (C and E) Right, semiquantification of fluorescence intensities. The photomicrographs are representative of three individual experiments. **, P < 0.01 versus control; ##, P < 0.01 versus HG in untreated or untransfected cells.
Fig 4
Fig 4
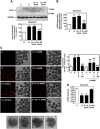
Peroxynitrite is required for eNOS uncoupling and the expression of fibronectin in response to high glucose. (A and B) HG causes a rapid increase in 3-nitrotyrosine, a footprint of peroxynitrite generation. Serum-deprived MCs were treated with 25 mM glucose (HG) for 10 min or 1 h, and 3-nitrotyrosine levels were assessed using an enzyme immunoassay kit (A) or immunofluorescence and confocal laser microscopy (B). Mannitol (Man) (20 mM mannitol plus 5 mM d-glucose) was used as osmotic control. (B) Histogram represents the semiquantification of fluorescence intensities. Values are the means ± SE from three independent experiments. **, P < 0.01 versus control. (C) Serum-deprived MCs were pretreated with uric acid (200 μM, 3 h), a peroxynitrite scavenger, or L-NAME (100 μM, 3 h) before exposure to HG for 10 min or 1 h, and 3-nitrotyrosine was evaluated by immunofluorescence staining. Right, semiquantification of fluorescence intensities. Values are the means ± SE from three independent experiments. **, P < 0.01 versus control; ##, P < 0.01 versus HG. (D) Serum-deprived MCs were pretreated with uric acid (200 μM, 3 h) before exposure to HG for 1 h or 24 h, and NO bioactivity was assessed by measuring cGMP synthesis. Values are the means ± SE from three independent experiments. **, P < 0.01 versus control. (E) Serum-deprived MCs were pretreated with uric acid (200 μM, 3 h) before exposure to HG for 1 h or 24 h, and eNOS dimer-to-monomer ratios were determined by low-temperature SDS-PAGE. Bottom, ratios of the intensities of eNOS dimer bands quantified by densitometry factored by the densitometric measurements of eNOS monomer bands. Values are the means ± SE from three independent experiments. **, P < 0.01 versus control. (F) Serum-deprived MCs were pretreated with uric acid (200 μM, 3 h) before exposure to HG for 24 h, and fibronectin protein expression was determined by direct immunoblotting of cell lysates. Bottom, histogram represents the ratios of the intensities of fibronectin bands quantified by densitometry factored by the densitometric measurements of GAPDH bands. The data are expressed as described in the legend to Fig. 3B and D. Values are the means ± SE from three independent experiments. **, P < 0.01 versus control; ##, P < 0.01 versus HG in untreated cells.
Fig 5
Fig 5
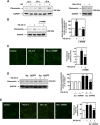
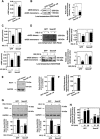
Nox4 is upregulated by HG and mediates HG-induced acute ROS production in MCs. (A) Serum-starved MCs were treated for the indicated times with HG (25 mM), and Nox4 protein expression was evaluated by Western blotting. Mannitol (Man) (20 mM mannitol plus 5 mM d-glucose) was used as osmotic control. (B) Serum-starved MCs were stimulated with HG (25 mM) for the indicated time periods, and NADPH-dependent superoxide generation in MC homogenates was measured by the lucigenin (5 μM)-enhanced chemiluminescence method. The initial rates of enzyme activity were calculated and expressed as relative chemiluminescence (light) units (RLU)/min/mg protein as described in Materials and Methods. Mannitol (Man) (20 mM mannitol plus 5 mM d-glucose) was used as osmotic control. Values are the means ± SE of three independent experiments. **, P < 0.01 versus control. (C) MCs were untransfected (−) or transfected with nontargeting siRNA (Scr) or siRNA for Nox4 (siNox4). Nox4 protein knockdown with siNox4 but not Scr was confirmed by Western blotting. Right, histogram represents the ratios of the intensities of Nox4 bands quantified by densitometry factored by the densitometric measurements of GAPDH bands. The data are expressed as percentages of control, where the ratio in the control was defined as 100%. **, P < 0.01 versus control; ##, P < 0.01 versus untransfected cells. (D, E, and F) MCs were untransfected or transfected with nontargeting siRNA (Scr) or siNox4 and exposed or not to HG (25 mM) for 10 min or 1 h. ROS generation was then assessed by measuring NADPH oxidase activities in MC homogenates (D) and DHE fluorescence with HPLC (E) or confocal microscopy (F). (F) Right, semiquantification of fluorescence intensities. Values are the means ± SE from three independent experiments. **, P < 0.01 versus control; ##, P < 0.01 versus HG in untransfected cells.
Fig 6
Fig 6
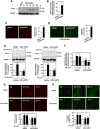
Nox4 mediates HG-induced early increase in peroxynitrite generation and eNOS dysfunction in MCs. (A) MCs were untransfected or transfected with nontargeting Scr or with siRNA for Nox4 (siNox4), and Nox4 protein expression was determined by Western blotting. (B and C) Serum-deprived MCs transfected with Scr or siNox4 were treated with or without HG (25 mM) for 10 min or 1 h, and 3-nitrotyrosine was assessed with an enzyme immunoassay kit (B) and immunofluorescence with confocal laser microscopy (C). (C) Right, semiquantification of fluorescence intensities. Values are the means ± SE from three independent experiments. **, P < 0.01 versus control. ##, P < 0.01 versus HG in untransfected cells. (D) MCs were infected with AdGFP or virus expressing wild type Nox4 (AdWTNox4), and levels of cGMP synthesis (middle) or eNOS dimer-to-monomer ratios (right) were determined. Left, immunoblotting with Nox4 antibody confirmed the overexpression of the oxidase from the adenovirus vector. **, P < 0.01 versus GFP vector-transfected cells. (E) Top and middle, serum-deprived MCs untransfected or transfected with Scr or siNox4 were treated with or without HG (25 mM) for 1 h or 24 h, and levels of cGMP synthesis or eNOS dimer-to-monomer ratios were assessed. Bottom, ratios of the intensities of eNOS dimer bands quantified by densitometry factored by the densitometric measurements of eNOS monomer bands. Values are the means ± SE from three independent experiments. **, P < 0.01 versus control.
Fig 7
Fig 7
Nox4-derived ROS mediates diabetes-induced decrease in nitric oxide bioavailability in glomeruli. (A) Expression of Nox4 protein was determined by direct immunoblotting of homogenized glomeruli. Representative results of Western blot analysis were obtained from two independent samples from each group. Bottom, histogram represents the ratios of the intensities of the Nox4 bands quantified by densitometry factored by the densitometric measurements of the actin GAPDH bands. The data are expressed as percentages of control (untreated or untransfected cells), where the ratio in the control was defined as 100%. Values are the means ± SE from four animals in each group. **, P < 0.01 versus control rats; ##, P < 0.01 versus diabetic rats. (B) NADPH oxidase activities in glomerular homogenates from diabetes (D), diabetes plus sense Nox4 (D + S Nox4), diabetes plus AS Nox4 (D + AS Nox4), and control (C) groups. NADPH-dependent superoxide generation was measured by lucigenin-enhanced chemiluminescence as described in the legend to Fig. 6B and D. Data represent the means ± SE of the activities from glomeruli of four animals for each group. **, P < 0.01 versus control rats; ##, P < 0.01 versus diabetic rats. (C) ROS production in isolated glomeruli was detected using DHE fluorescence. Isolated glomeruli were preincubated with or without L-NAME (100 μM) and then loaded with 10 μM DHE in the dark for 30 min at 37°C. After a wash with HBSS, the glomeruli were placed in cover glass chambers and fluorescence was monitored by laser confocal microscopy. Representative pictures from four rats per group are shown. Right, relative levels of DHE fluorescence (arbitrary units) were semiquantified. Histogram represents the means ± SE of 10 individual glomeruli in sections from four individual rats in each group. **, P < 0.01 versus control rats; ##, P < 0.01 versus diabetic rats. Bottom, photographs of the isolated glomeruli. (D) cGMP formation was measured in isolated glomeruli. Values are the means ± SE of four different animals. **, P < 0.01 versus control rats.
Fig 8
Fig 8
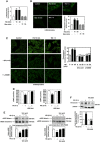
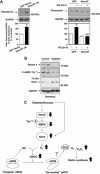
AMPK blocks HG-induced eNOS dysfunction in MCs. (A) MCs were treated with HG (25 mM) for the time periods indicated, and AMPK phosphorylation was assessed by direct immunoblotting using anti-phospho-specific antibodies recognizing phosphorylated threonine 172 (P-AMPK Thr172). Bottom, histograms represent the ratios of the intensities of tyrosine-phosphorylated AMPK bands quantified by densitometry factored by the densitometric measurements of GAPDH bands. Data are expressed as percentages of the control, where the ratio in the control was defined as 100%. Values are the means ± SE from three independent experiments. **, P < 0.01 versus control. (B) MCs were infected with adenovirus encoding dominant-negative AMPKα2 (AdDN-AMPK), constitutively active AMPKγ (AdCA-AMPK), or β-galactosidase (AdβGal). Overexpression of AMPKα2 and AMPKγ from the adenovirus vectors is shown. GAPDH was used as a loading control. (C) Left, MCs were infected with AdDN-AMPK or AdβGal, and cGMP synthesis was determined. Middle and right, MCs were infected with AdCA-AMPK or AdβGal and treated with HG (1 h or 24 h), and levels of cGMP synthesis were determined. Values are the means ± SE from three independent experiments. **, P < 0.01 versus AdβGal-infected cells.
Fig 9
Fig 9
AMPK blocks HG-induced Nox4-dependent ROS generation in MCs. (A) MCs were infected with AdDN-AMPK or AdβGal, and levels of Nox4 protein expression were assessed by direct immunoblotting. (B) MCs were infected with AdDN-AMPK or AdβGal, and NADPH oxidase activities were determined. Values are the means ± SE from three independent experiments. **, P < 0.01 versus AdβGal-infected cells. (C and D) MCs were infected with AdDN-AMPK or AdβGal, and levels of DHE fluorescence (C) or 3-nitrotyrosine staining (D) were assessed with confocal laser microscopy. The photomicrographs are representative of three individual experiments. For each panel, fluorescence intensity was semiquantified. Values are the means ± SE from three independent experiments. **, P < 0.01 versus control (AdβGal-infected cells). (E) MCs were infected with AdCA-AMPK or AdβGal and treated with HG (10 min or 1 h), and levels of Nox4 protein expression were assessed by direct immunoblotting. Bottom, histograms represent the ratios of the intensities of Nox4 bands quantified by densitometry factored by the densitometric measurements of GAPDH bands. Data are expressed as percentages of control (AdβGal-infected cells), where the ratio in the control was defined as 100%. Values are the means ± SE from three independent experiments. **, P < 0.01 versus control (AdβGal-infected cells); ##, P < 0.01 versus HG in AdβGal-infected cells. (F) MCs were infected with AdCA-AMPK or AdβGal and treated with HG (10 min or 1 h), and NADPH oxidase activities were determined. Values are the means ± SE from three independent experiments. **, P < 0.01 versus control (AdβGal-infected cells); ##, P < 0.01 versus HG in AdβGal-infected cells. (G and H) MCs were infected with AdCA-AMPK or AdβGal and treated with HG (10 min or 1 h), and levels of DHE fluorescence (G) or 3-nitrotyrosine staining (H) were assessed with confocal laser microscopy. Photomicrographs are representative of three individual experiments. For each panel, fluorescence intensity was semiquantified. Values are the means ± SE from three independent experiments. **, P < 0.01 versus control (AdβGal-infected cells); ##, P < 0.01 versus HG in AdβGal-infected cells.
Fig 10
Fig 10
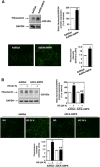
AMPK blocks HG-induced fibronectin synthesis in MCs, (A) MCs were infected with AdDN-AMPK or AdβGal, and levels of fibronectin protein expression were determined by direct immunoblotting of cell lysates (top) or by immunofluorescence and confocal microscopy (bottom). (B) MCs were infected with AdCA-AMPK or AdβGal and treated with HG (24 h), and levels of fibronectin protein expression were determined by direct immunoblotting of cell lysates (top) or by immunofluorescence and confocal microscopy (bottom). (A and B) Data were quantified and expressed as described in the legend to Fig. 3B and C. Values are the means ± SE from three independent experiments. **, P < 0.01 versus AdβGal-infected cells; ##, P < 0.01 versus HG in AdβGal-infected cells.
Fig 11
Fig 11
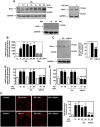
Sestrin 2 prevents HG-induced AMPK inactivation in MCs. (A) MCs were treated with HG (25 mM) for the time periods indicated, and sestrin 2 protein expression was assessed by direct immunoblotting. Mannitol (Man) (20 mM mannitol + 5 mM d-glucose) was used as osmotic control. Middle, histograms represent the ratios of the intensities of sestrin 2 bands quantified by densitometry factored by the densitometric measurements of GAPDH bands. The data are expressed as percentages of control, where the ratio in the control was defined as 100%. Values are the means ± SE from three independent experiments. **, P < 0.01 versus control. (B) MCs were transfected with Sesn2F-ΔN or GFP vector, and levels of AMPK phosphorylation were assessed by direct immunoblotting using anti-phospho-specific antibodies recognizing phosphorylated threonine 172 (P-AMPK Thr172). (C) MCs were transfected with Sesn2F or GFP vector and treated with HG (1 h or 24 h), and levels of AMPK phosphorylation were assessed by direct immunoblotting using anti-phospho-specific antibodies recognizing phosphorylated threonine 172 (P-AMPK Thr172). The data were quantified and expressed as described in the legend to Fig. 8A. Values are the means ± SE from three independent experiments. **, P < 0.01 versus GFP vector-transfected cells.
Fig 12
Fig 12
Sestrin 2 prevents HG-induced Nox4-dependent eNOS dysfunction in MCs. (A and B) MCs were transfected with Sesn2F-ΔN or GFP vector, and levels of cGMP synthesis (A) or eNOS dimer-to-monomer ratios (B) were determined. (C and D) MCs were transfected with Sesn2F or GFP vector and treated with HG (1 h or 24 h), and levels of cGMP synthesis (C) or eNOS dimer-to-monomer ratios (D) were determined. (B and D) Data were quantified and expressed as described in the legend to Fig. 2D. Values are the means ± SE from three independent experiments. **, P < 0.01 versus GFP vector-transfected cells. (E and F) MCs were transfected with Sesn2F-ΔN or GFP vector, and levels of Nox4 protein expression (E) or NADPH oxidase activities were assessed (F). (E) Right, data were quantified and expressed as described in the legend to Fig. 9E. Values are the means ± SE from three independent experiments. **, P < 0.01 versus control (GFP vector-transfected cells). (G and H) MCs were transfected with Sesn2F or GFP vector and treated with HG (10 min or 1 h), and levels of Nox4 protein expression (G) or NADPH oxidase activities (H) were assessed. (G) Bottom, data were quantified and expressed as described in the legend to Fig. 9E. Values are the means ± SE from three independent experiments. **, P < 0.01 versus control (GFP vector-transfected cells); ##, P < 0.01 versus HG in GFP vector-transfected cells.
Fig 13
Fig 13
(A) Sestrin 2 prevents HG-induced fibronectin synthesis in MCs. Left, MCs were transfected with Sesn2F-ΔN or GFP vector, and levels of fibronectin protein expression were assessed. Right, MCs were transfected with Sesn2F or GFP vector and treated with HG for the indicated times, and levels of fibronectin protein expression were assessed. Data were quantified and expressed as described in the legend to Fig. 3B. Values are the means ± SE from three independent experiments. **, P < 0.01 versus control (GFP vector-transfected cells); ##, P < 0.01 versus HG in GFP vector-transfected cells. (B) Downregulation of sestrin 2 is associated with a decrease in AMPK phosphorylation and an increase in Nox4 expression in glomeruli from diabetic rats. Sestrin 2 and Nox4 protein expression or AMPK phosphorylation on Thr172 were detected by direct immunoblotting in glomerular homogenates. Representative Western blot analysis was obtained from two independent samples from each group (Control and Diabetes). (C) Proposed molecular mechanisms of HG-induced fibronectin synthesis in MCs. See Discussion for details.

Similar articles

Cited by

References

    1. Kanwar YS, Sun L, Xie P, Liu FY, Chen S. 2011. A glimpse of various pathogenetic mechanisms of diabetic nephropathy. Annu. Rev. Pathol. 6:395–423 - PMC - PubMed
    1. Abboud HE. 2012. Mesangial cell biology. Exp. Cell Res. 318:979–985 - PubMed
    1. Singh DK, Winocour P, Farrington K. 2011. Oxidative stress in early diabetic nephropathy: fueling the fire. Nat. Rev. Endocrinol. 7:176–184 - PubMed
    1. Lassègue B, San Martín A, Griendling KK. 2012. Biochemistry, physiology, and pathophysiology of NADPH oxidases in the cardiovascular system. Circ. Res. 110:1364–1390 - PMC - PubMed
    1. Nistala R, Whaley-Connell A, Sowers JR. 2008. Redox control of renal function and hypertension. Antioxid. Redox Signal. 10:2047–2089 - PMC - PubMed

Publication types

MeSH terms