

Eukaryote-specific insertion elements control human ARGONAUTE slicer activity
- PMID: 23809764
- PMCID: PMC3757560
- DOI: 10.1016/j.celrep.2013.06.010
Eukaryote-specific insertion elements control human ARGONAUTE slicer activity
Abstract
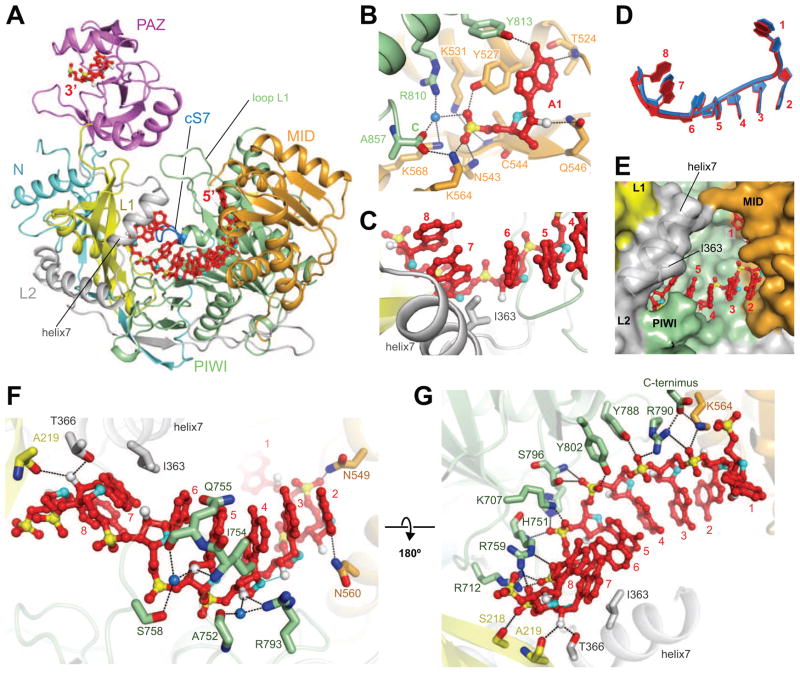
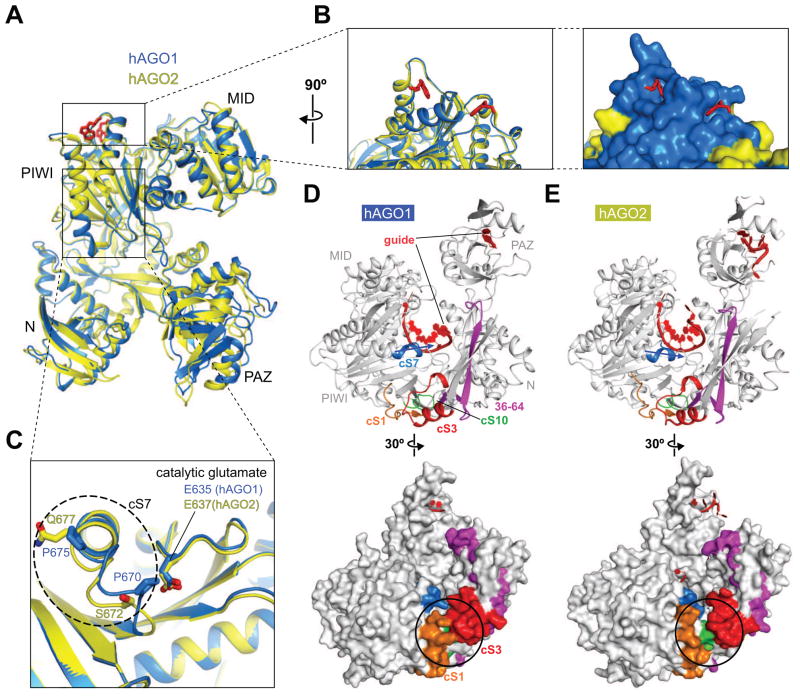
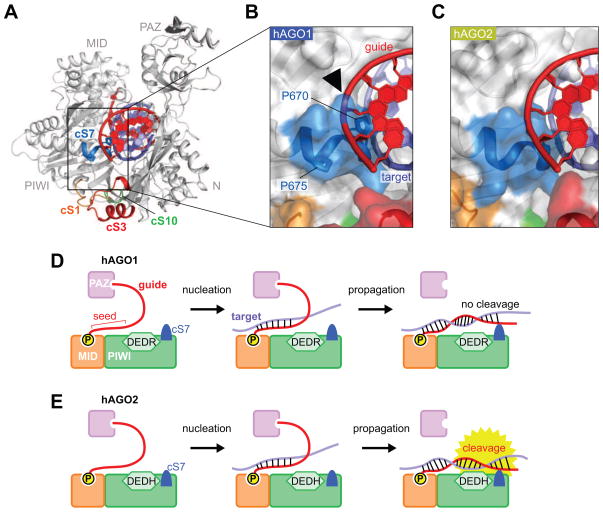
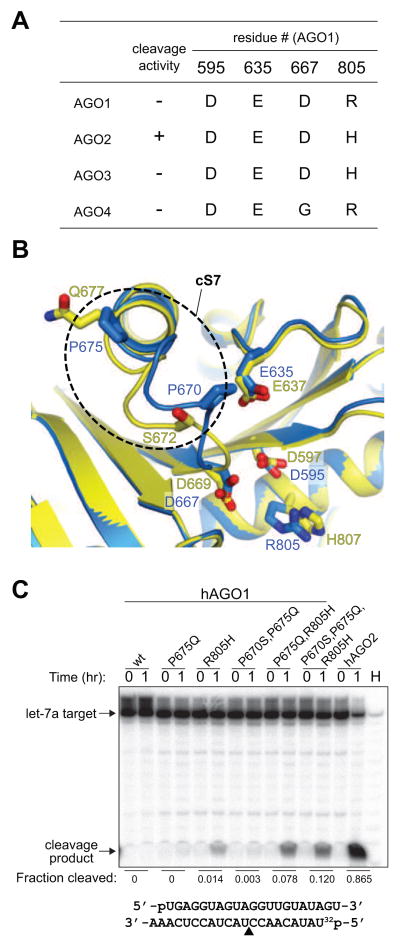
We have solved the crystal structure of human ARGONAUTE1 (hAGO1) bound to endogenous 5'-phosphorylated guide RNAs. To identify changes that evolutionarily rendered hAGO1 inactive, we compared our structure with guide-RNA-containing and cleavage-active hAGO2. Aside from mutation of a catalytic tetrad residue, proline residues at positions 670 and 675 in hAGO1 introduce a kink in the cS7 loop, forming a convex surface within the hAGO1 nucleic-acid-binding channel near the inactive catalytic site. We predicted that even upon restoration of the catalytic tetrad, hAGO1-cS7 sterically hinders the placement of a fully paired guide-target RNA duplex into the endonuclease active site. Consistent with this hypothesis, reconstitution of the catalytic tetrad with R805H led to low-level hAGO1 cleavage activity, whereas combining R805H with cS7 substitutions P670S and P675Q substantially augmented hAGO1 activity. Evolutionary amino acid changes to hAGO1 were readily reversible, suggesting that loading of guide RNA and pairing of seed-based miRNA and target RNA constrain its sequence drift.
Copyright © 2013 The Authors. Published by Elsevier Inc. All rights reserved.
Figures
Similar articles
-
The making of a slicer: activation of human Argonaute-1.Cell Rep. 2013 Jun 27;3(6):1901-9. doi: 10.1016/j.celrep.2013.05.033. Epub 2013 Jun 6. Cell Rep. 2013. PMID: 23746446 Free PMC article.
-
Turning catalytically inactive human Argonaute proteins into active slicer enzymes.Nat Struct Mol Biol. 2013 Jul;20(7):814-7. doi: 10.1038/nsmb.2577. Epub 2013 May 12. Nat Struct Mol Biol. 2013. PMID: 23665583
-
Multivalent Recruitment of Human Argonaute by GW182.Mol Cell. 2017 Aug 17;67(4):646-658.e3. doi: 10.1016/j.molcel.2017.07.007. Epub 2017 Aug 3. Mol Cell. 2017. PMID: 28781232 Free PMC article.
-
Eukaryotic Argonautes come into focus.Trends Biochem Sci. 2013 May;38(5):263-71. doi: 10.1016/j.tibs.2013.02.008. Epub 2013 Mar 29. Trends Biochem Sci. 2013. PMID: 23541793 Review.
-
The evolutionary journey of Argonaute proteins.Nat Struct Mol Biol. 2014 Sep;21(9):743-53. doi: 10.1038/nsmb.2879. Nat Struct Mol Biol. 2014. PMID: 25192263 Free PMC article. Review.
Cited by
-
From guide to target: molecular insights into eukaryotic RNA-interference machinery.Nat Struct Mol Biol. 2015 Jan;22(1):20-8. doi: 10.1038/nsmb.2931. Nat Struct Mol Biol. 2015. PMID: 25565029 Free PMC article. Review.
-
siRNA Seed Region Is Divided into Two Functionally Different Domains in RNA Interference in Response to 2'-OMe Modifications.ACS Omega. 2022 Jan 4;7(2):2398-2410. doi: 10.1021/acsomega.1c06455. eCollection 2022 Jan 18. ACS Omega. 2022. PMID: 35071927 Free PMC article.
-
GW182-Free microRNA Silencing Complex Controls Post-transcriptional Gene Expression during Caenorhabditis elegans Embryogenesis.PLoS Genet. 2016 Dec 9;12(12):e1006484. doi: 10.1371/journal.pgen.1006484. eCollection 2016 Dec. PLoS Genet. 2016. PMID: 27935964 Free PMC article.
-
The Slicer Activity of ARGONAUTE1 Is Required Specifically for the Phasing, Not Production, of Trans-Acting Short Interfering RNAs in Arabidopsis.Plant Cell. 2016 Jul;28(7):1563-80. doi: 10.1105/tpc.16.00121. Epub 2016 Jun 27. Plant Cell. 2016. PMID: 27354557 Free PMC article.
-
Are Argonaute-Associated Tiny RNAs Junk, Inferior miRNAs, or a New Type of Functional RNAs?Front Mol Biosci. 2021 Dec 3;8:795356. doi: 10.3389/fmolb.2021.795356. eCollection 2021. Front Mol Biosci. 2021. PMID: 34926585 Free PMC article. Review.
References
-
- Adams PD, Grosse-Kunstleve RW, Hung LW, Ioerger TR, McCoy AJ, Moriarty NW, Read RJ, Sacchettini JC, Sauter NK, Terwilliger TC. PHENIX: building new software for automated crystallographic structure determination. Acta Crystallogr D Biol Crystallogr. 2002;58:1948–1954. - PubMed
-
- Ayres MD, Howard SC, Kuzio J, Lopez-Ferber M, Possee RD. The complete DNA sequence of Autographa californica nuclear polyhedrosis virus. Virology. 1994;202:586–605. - PubMed
-
- Bartel DP. MicroRNAs: genomics, biogenesis, mechanism, and function. Cell. 2004;116:281–297. - PubMed
-
- Brunger AT. Version 1.2 of the Crystallography and NMR system. Nat Protoc. 2007;2:2728–2733. - PubMed
Publication types
MeSH terms
Substances
Associated data
- Actions
Grants and funding
LinkOut - more resources
Full Text Sources
Other Literature Sources
Molecular Biology Databases
