. 2013 Jul 9;110(28):E2592-601.
doi: 10.1073/pnas.1300113110. Epub 2013 Jun 25.

Histone deacetylase 10 promotes autophagy-mediated cell survival

Affiliations

Histone deacetylase 10 promotes autophagy-mediated cell survival

Ina Oehme et al. Proc Natl Acad Sci U S A. .

Abstract

Tumor cells activate autophagy in response to chemotherapy-induced DNA damage as a survival program to cope with metabolic stress. Here, we provide in vitro and in vivo evidence that histone deacetylase (HDAC)10 promotes autophagy-mediated survival in neuroblastoma cells. We show that both knockdown and inhibition of HDAC10 effectively disrupted autophagy associated with sensitization to cytotoxic drug treatment in a panel of highly malignant V-MYC myelocytomatosis viral-related oncogene, neuroblastoma derived-amplified neuroblastoma cell lines, in contrast to nontransformed cells. HDAC10 depletion in neuroblastoma cells interrupted autophagic flux and induced accumulation of autophagosomes, lysosomes, and a prominent substrate of the autophagic degradation pathway, p62/sequestosome 1. Enforced HDAC10 expression protected neuroblastoma cells against doxorubicin treatment through interaction with heat shock protein 70 family proteins, causing their deacetylation. Conversely, heat shock protein 70/heat shock cognate 70 was acetylated in HDAC10-depleted cells. HDAC10 expression levels in high-risk neuroblastomas correlated with autophagy in gene-set analysis and predicted treatment success in patients with advanced stage 4 neuroblastomas. Our results demonstrate that HDAC10 protects cancer cells from cytotoxic agents by mediating autophagy and identify this HDAC isozyme as a druggable regulator of advanced-stage tumor cell survival. Moreover, these results propose a promising way to considerably improve treatment response in the neuroblastoma patient subgroup with the poorest outcome.

Keywords: HDAC inhibitor; childhood tumors; drug resistance.


Conflict of interest statement

The authors declare no conflict of interest.

Figures

Fig. 1.
Fig. 1.
HDAC10 tumor expression separates treatment outcome of high-risk neuroblastoma patients. (A) Kaplan–Meier curves are shown for overall survival in high-risk neuroblastoma patients (INSS stage 4; AMC cohort) whose tumors expressed low (n = 11) or high (n = 29) levels of HDAC10. Scan modus was used for cutoff determination, and P values were corrected for multiple testing (Bonferroni). The R2 microarray analysis and visualization platform (http://r2.amc.nl) was used for calculations and is the source of the data. (B) Kaplan–Meier curves are shown for overall survival in low-risk neuroblastoma patients (INSS stages 1, 2, 3, and 4s; AMC cohort) whose tumors expressed low (n = 18) or high (n = 30) levels of HDAC10. Tests were run in the same way and using the same tool as in A. (C) Kaplan–Meier curves are shown for overall survival in high-risk neuroblastoma patients (INSS stage 4; NCI cohort; n = 31) whose tumors expressed low (n = 24) or high (n = 7) levels of HDAC10. Expression data were obtained from the Neuroblastoma Prognosis Database of the NCI Oncogenomics Data Center (http://home.CCR.cancer.gov/oncology/oncogenomics). Cutoff was determined using a P value minimization check, and P values were corrected for multiple testing using the Bonferroni method.
Fig. 2.
Fig. 2.
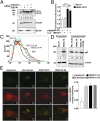
Depletion of HDAC10 promotes accumulation of acidic vesicular organelles. (A) Western blot of whole-cell lysates of BE(2)-C cells transfected with siRNAs #1 and #2 targeting HDAC10 showing HDAC10 and HDAC6 protein expression 48 h and 6 d after transfection. β-Actin expression served as a loading control. The ratio of HDAC10:β-actin or HDAC6:β-actin expression relative to the untransfected control was inserted below the Western blots for HDAC10 and HDAC6 expression, respectively. Expression in the three control situations are also shown: mock, mock-transfected cells; NC #1, cells transfected with negative control siRNA; untransfected, cells not undergoing transfection and cultured in normal medium. (B) Phase-contrast micrographs of cells 72 h and 6 d after transfection with siRNAs targeting HDAC10 (siRNA #1 and #2) or negative control NC #1 siRNA. Morphological alterations suggestive of autophagy, such as massive cytosolic vacuolization of the cells, appeared only in cells after HDAC10 knockdown and are indicated by arrows. (C) Accumulation of acidic organelles 72 h and 6 d after transfection of BE(2)-C and Kelly cells with two siRNAs specific for HDAC10 (HDAC10 #1 and #2) or the negative control siRNA (NC #1) detected after acridine orange staining (red fluorescence) by FACS for quantification and on a microscope for visualization microscopically (inlay). (Scale bar: 50 µm.) Cells were also treated with 10 nM bafilomycin A1 (BAF) or 100 nM rapamycin (positive control). Means from at least three independent experiments are shown, and error bars represent SEM. Asterisks indicate the level of significance between testing groups from an unpaired two-tailed t test. *P < 0.05; **P < 0.01; ***P < 0.001. (D) Expression of the LAMP-2 lysosomal marker protein is shown in Western blots of whole-cell lysates 6 d after transfection with HDAC10 siRNAs #1 and #2 or negative control siRNA (NC #1). β-Actin was used as a loading control. Numbers indicate LAMP-2 expression relative to the negative control, normalized to β-actin expression. (E) Autophagosome formation was visualized after HDAC10 knockdown by transient transfection with the EGFP-LC3 expression construct. Punctate staining is indicative for the redistribution of EGFP-LC3 to autophagosomes. Pictures were taken 72 h and 6 d after transfection with siRNAs. Cells treated for 24 h with 100 nM rapamycin or for 5 h with 25 µM chloroquine are shown as positive controls. ImageJ quantification of three independent experiments, each including at least 25 cells per treatment is shown to the right of the representative pictures for the respective time points. HDAC10 #1, HDAC10 siRNA #1; HDAC10 #2, HDAC10 siRNA #2; NC #1, negative control siRNA #1. (F) LC3-I and LC3-II expression in whole-cell lysates of BE(2)-C cells 6 d after transfection with HDAC10 siRNAs #1 or #2 or negative control siRNA (NC #1) detected by Western blotting. β-Actin was used as a loading control. The ratios of LC3-II to LC3-I expression normalized to untransfected cells (UN) are included below the Western blot, and the normalized ratios from three independent experiments are shown in the bar graph below.
Fig. 3.
Fig. 3.
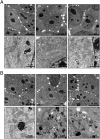
Depletion of HDAC10 increases the presence of autophagic structures. Representative transmission electron micrographs of BE(2)-C cells 72 h after transfection with negative control (NC) siRNA #1 (A) or siRNA #1 against HDAC10 (B). In B, autophagosomes (AP) and acidic vesicles (AV) with electron-dense material were apparent under the higher magnification.
Fig. 4.
Fig. 4.
Autophagic flux requires HDAC10. (A) Western blot showing LC3-I and LC3-II expression in whole-cell lysates of BE(2)-C cells 6 d after transfection with HDAC10 siRNA #1 or BECN1 siRNA. Anti-Beclin antibody was used to control for BECN1 knockdown, and β-actin was used as a loading control. Ratios of LC3-II to LC3-I are shown below the Western blot. (B) Accumulation of acidic organelles (red fluorescence) detected by acridine orange staining in FACS analysis after knockdown of HDAC10 with and without BECN1 knockdown compared with the negative controls, as indicated. Means of at least three independent experiments are shown. Error bars represent SEM. Significant differences between groups were detected by unpaired two-tailed t test. **P < 0.01; ***P < 0.001; n.s., not significant. (C) EGFP-LC3 accumulation in BE(2)-C cells 6 d after transfection with the siRNA indicated was detected in FACS analysis and is shown as log10 fluorescence. Untransfected BE(2)-C cells were treated with 100 nM bafilomycin A1 (BAF), a lysosomal inhibitor that served as a positive control for the inhibition of autophagic flux. One representative result from at least three independent experiments is shown. (D) Expression of p62 protein levels upon knockdown or forced HDAC10 overexpression in BE(2)-C cells. β-Actin served as a loading control. Numbers indicate p62 expression normalized to β-actin expression. HDAC10 H135A, expression construct for HDAC10 with the H135A mutation in the deacetylase domain; NC #1, negative control siRNA; NC vector, empty expression construct. (E) Fluorescence microscopic detection of autophagosome-lysosome fusion in BE(2)-C cells transiently transfected with the mCherry-EGFP-LC3B expression construct 6 d after HDAC10 knockdown (HDAC10 #1 and HDAC10 #2). Untransfected BE(2)-C cells were treated with 100 nM rapamycin as a control for effective fusion and treated with 25 µM chloroquine as a control for defective fusion. Green signals for EGFP-LC3B expression indicate autophagosomes. Red signals for mCherry-LC3B expression indicate autophagosomes and autophagolysosomes. Yellow overlay indicates autophagosomes only, whereas red-only signals in the overlay indicate autophagolysosomes and the overlap coefficient, determined from at least five cells per condition, is shown in the bar graph (means ± SEM) to the right. (Scale bar: 5 µm.)
Fig. 5.
Fig. 5.
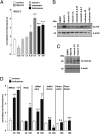
HDAC10 inhibition induces accumulation of acidic organelles. (A) BE(2)-C cells treated with class I HDAC inhibitor MS-275 and class IIb HDAC inhibitors (tubacin, tubastatin, or bufexamac) as indicated (in µM). The accumulation of acidic organelles (normalized red fluorescence) was monitored by FACS after staining with acridine orange. (B) Acetylation of histone 4 (Ac-H4) upon treatment of BE(2)-C cells with HDAC inhibitors as indicated. β-Actin served as a loading control. (C) Acetylation of tubulin upon treatment of BE(2)-C cells with MS-275 and tubacin as indicated. β-Actin served as a loading control. (D) The BE(2)-C, Kelly, and IMR32 neuroblastoma cell lines; the neural crest-derived JoMa1 cells, which can be retained in an immortalized and undifferentiated state via 4-OHT supplementation to activate MYC expression (JoMa1 plus) and in an differentiated state upon 4-OHT removal (JoMa1 minus); and untransformed astrocytes and fibroblasts were treated with 30 or 100 µM bufexamac for 24 h and then stained with acridine orange. The accumulation of acidic organelles was quantified by FACS analysis (normalized red fluorescence). Red fluorescence in treated cells was normalized to red fluorescence in untreated cells in all experiments. Bars represent means (±SEM) of at least three independent experiments. Significant differences between groups were tested using an unpaired, two-tailed t test. **P < 0.01; ***P < 0.001.
Fig. 6.
Fig. 6.
HDAC10 expression supports neuroblastoma cell survival. (A) BE(2)-C, Kelly, and IMR32 cell lines were treated with increasing concentrations of doxorubicin (0.01, 0.05, 0.1 µg/mL) and then monitored at 24, 48, and 72 h after treatment for cell death using trypan blue staining (dead cells, trypan blue-staining cells). (B) Stable hygromycin-resistant HDAC10-overexpressing IMR32 cells (filled bars) or hygromycin-resistant empty vector IMR32 control cells (NC vector; open bars) were treated with doxorubicin (0.0025 µg/mL). Colonies were stained (inlay picture) and quantified (bar diagram). Western Blot shows HDAC10 overexpression of the stably transfected cells; β-actin was used as a loading control. (C) BE(2)-C cells were treated with high-dose doxorubicin (0.5 µg/mL) after HDAC10 knockdown. Western Blot shows p62 expression after 48 h of doxorubicin treatment. Expression in control-transfected (NC siRNA #1) and untreated controls are shown as indicated. Numbers indicate p62 expression normalized to β-actin expression. (D) BE(2)-C cells were stably transfected with four different shRNAs targeting HDAC10 (shR-1, -2, -3, -4) or the negative control (shR-NC). Cells were treated with 0.05 µg/mL doxorubicin or normal culture medium, colonies were stained after 10 d, and results were quantified (bar diagram; shR-NC, open bars; shR-HDAC10, filled bars). Western Blot shows HDAC10 expression of the stably transfected cells; β-actin was used as a loading control. (E) Embryonal tumor-derived cell lines and normal murine neural crest-derived cells (JoMa1), as well as human fibroblasts, were treated with the HDAC6/10 inhibitor bufexamac alone or in combination with the cytotoxic agent doxorubicin. Where treatment is indicated, all cell types were treated with 30 µM bufexamac for 6 d. Doxorubicin treatment, where indicated, started 72 h before the detection of apoptotic cells by PI staining of ethanol-fixed cells and was applied at varied concentrations: neuroblastoma cell lines, BE(2)-C (0.1 µg/mL), Kelly (0.05 µg/mL), and IMR32 (0.01 µg/mL), the Med8A medulloblastoma cell line (0.1 µg/mL), and JoMa1 (0.01 µg/mL) and fibroblasts (0.1 µg/mL). Bars reflect the amount of cells in the sub-G1 area of the cell cycle profile. (F) BE(2)-C cells were treated with bufexamac alone or in combination with doxorubicin, and colonies were stained after 10 d. Where treatment is indicated, all cell types were treated with 30 µM bufexamac. Doxorubicin treatment, where indicated, varied in concentration: BE(2)-C (0.1 µg/mL), Kelly (0.05 µg/mL), IMR32 (0.01 µg/mL), and Med8A (0.1 µg/mL). (G) BE(2)-C cells were treated with 30 µM bufexamac for 6 d, where indicated, and cotreated with 10 ng/mL vincristine for the last 72 h, where indicated. Bars reflect the amount of cells in the sub-G1 area of the cell cycle profile of PI-stained ethanol-fixed cells. All bars represent means (±SEM) of at least three independent experiments. Significant differences between groups were tested using an unpaired, two-tailed t test. *P < 0.05; **P < 0.01; ***P < 0.001; n.s., not significant.
Fig. 7.
Fig. 7.
HDAC10 physically interacts with Hsc70/Hsp70 and affects its acetylation. (A) Graphical representation of the macroautophagy process, with indications of where interventions occur via siRNA knockdown and drug treatment. Early inhibitors interfere with the formation of autophagosomes (APh). Late inhibitors block the autophagic process via interference with lysosomal (Lys) activity and prevention of autolysosome (AL) formation. (B) Whole-cell extracts (input) of BE(2)-C cells transfected with either a HDAC10 expression construct (HDAC10) or empty vector (NC vector) and treated with 75 nM TSA or solvent control, as indicated, were immunoprecipitated with an antibody directed against the FLAG tag. HDAC10 and Hsc70/Hsp70 proteins in the extracts and immunoprecipitated complexes were detected on Western blots. IP-NC indicates the immunoprecipitation negative control. (C) Whole-cell extracts (input) of BE(2)-C cells treated with 75 nM TSA or solvent control, as indicated, were immunoprecipitated with an antibody directed against the Hsc70/Hsp70 proteins. HDAC10 and Hsc70/Hsp70 proteins in the extracts and immunoprecipitated complexes were detected on Western blots. IP-NC indicates the immunoprecipitation negative control. (D and E) Detection of lysine acetylation (Ac-Lyc) in Hsc70/Hsp70 on Western blots of whole-cell extracts (input) and proteins immunoprecipitated with an antibody against the Hsc70/Hsp70 proteins. BE(2)-C cells were transfected with either a HDAC10 expression construct (HDAC10) or empty vector (NC vector) (D) or with siRNA against HDAC10 (HDAC10 #1) or a negative control siRNA (NC#1) (E) before extraction and immunoprecipitation. (F) Immunofluorescent microscopy of BE(2)-C cells transfected with FLAG-tagged HDAC10. Cells were immunostained for the FLAG tag (cyan) and for Hsc70/Hsp70 (magenta). Cytoplasmic colocalization is shown by overlay in white. (G) IMR32 cells overexpressing HDAC10 or HDAC10-H135A or transfected with empty vector (NC vector) were treated 48 h with 0.01 µg/mL doxorubicin and the Hsc70/Hsp70 inhibitor PES (10 µM), where indicated. Apoptotic cells in the sub-G1 area of the cell cycle profile of PI-stained and ethanol-fixed cells were measured and are displayed as means (±SEM) of at least three independent experiments. Significant differences between groups were tested using a paired, two-tailed t test. *P < 0.05.

Similar articles

Cited by

References

    1. Pan Y, et al. Targeting autophagy augments in vitro and in vivo antimyeloma activity of DNA-damaging chemotherapy. Clin Cancer Res. 2011;17(10):3248–3258. - PubMed
    1. Klionsky DJ, Cuervo AM, Seglen PO. Methods for monitoring autophagy from yeast to human. Autophagy. 2007;3(3):181–206. - PubMed
    1. Klionsky DJ, Emr SD. Autophagy as a regulated pathway of cellular degradation. Science. 2000;290(5497):1717–1721. - PMC - PubMed
    1. Dice JF. Chaperone-mediated autophagy. Autophagy. 2007;3(4):295–299. - PubMed
    1. Agarraberes FA, Dice JF. A molecular chaperone complex at the lysosomal membrane is required for protein translocation. J Cell Sci. 2001;114(Pt 13):2491–2499. - PubMed

Publication types

MeSH terms

Substances