Propulsion and navigation within the advancing monolayer sheet
- PMID: 23793160
- PMCID: PMC3750079
- DOI: 10.1038/nmat3689
Propulsion and navigation within the advancing monolayer sheet
Abstract
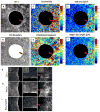
As a wound heals, or a body plan forms, or a tumour invades, observed cellular motions within the advancing cell swarm are thought to stem from yet to be observed physical stresses that act in some direct and causal mechanical fashion. Here we show that such a relationship between motion and stress is far from direct. Using monolayer stress microscopy, we probed migration velocities, cellular tractions and intercellular stresses in an epithelial cell sheet advancing towards an island on which cells cannot adhere. We found that cells located near the island exert tractions that pull systematically towards this island regardless of whether the cells approach the island, migrate tangentially along its edge, or paradoxically, recede from it. This unanticipated cell-patterning motif, which we call kenotaxis, represents the robust and systematic mechanical drive of the cellular collective to fill unfilled space.
Figures


Comment in
-
Cell migration: Towards the void.Nat Mater. 2013 Sep;12(9):783-4. doi: 10.1038/nmat3743. Nat Mater. 2013. PMID: 23966050 No abstract available.
Similar articles
-
Relationship between velocities, tractions, and intercellular stresses in the migrating epithelial monolayer.Phys Rev E. 2020 Jun;101(6-1):062405. doi: 10.1103/PhysRevE.101.062405. Phys Rev E. 2020. PMID: 32688543 Free PMC article.
-
Electric field-induced migration and intercellular stress alignment in a collective epithelial monolayer.Mol Biol Cell. 2018 Sep 15;29(19):2292-2302. doi: 10.1091/mbc.E18-01-0077. Epub 2018 Jul 25. Mol Biol Cell. 2018. PMID: 30044714 Free PMC article.
-
Collective cell guidance by cooperative intercellular forces.Nat Mater. 2011 Jun;10(6):469-75. doi: 10.1038/nmat3025. Nat Mater. 2011. PMID: 21602808 Free PMC article.
-
Plithotaxis and emergent dynamics in collective cellular migration.Trends Cell Biol. 2011 Nov;21(11):638-46. doi: 10.1016/j.tcb.2011.06.006. Epub 2011 Jul 23. Trends Cell Biol. 2011. PMID: 21784638 Free PMC article. Review.
-
Direction-dependent contraction forces on cell boundaries induce collective migration of epithelial cells within their sheet.Dev Growth Differ. 2017 Jun;59(5):317-328. doi: 10.1111/dgd.12361. Epub 2017 Jun 19. Dev Growth Differ. 2017. PMID: 28627717 Review.
Cited by
-
Notch1-Dll4 signalling and mechanical force regulate leader cell formation during collective cell migration.Nat Commun. 2015 Mar 13;6:6556. doi: 10.1038/ncomms7556. Nat Commun. 2015. PMID: 25766473 Free PMC article.
-
Shape and Displacement Fluctuations in Soft Vesicles Filled by Active Particles.Sci Rep. 2016 Sep 28;6:34146. doi: 10.1038/srep34146. Sci Rep. 2016. PMID: 27678166 Free PMC article.
-
Predicting Collective Migration of Cell Populations Defined by Varying Repolarization Dynamics.Biophys J. 2018 Dec 18;115(12):2474-2485. doi: 10.1016/j.bpj.2018.11.013. Epub 2018 Nov 17. Biophys J. 2018. PMID: 30527449 Free PMC article.
-
Fluid mechanics as a driver of tissue-scale mechanical signaling in organogenesis.Curr Pathobiol Rep. 2016 Dec;4(4):199-208. doi: 10.1007/s40139-016-0117-3. Epub 2016 Sep 29. Curr Pathobiol Rep. 2016. PMID: 28163984 Free PMC article.
-
Cell Jamming in the Airway Epithelium.Ann Am Thorac Soc. 2016 Mar;13 Suppl 1(Suppl 1):S64-7. doi: 10.1513/AnnalsATS.201507-476MG. Ann Am Thorac Soc. 2016. PMID: 27027955 Free PMC article. Review.
References
-
- Rand H. Rouxs Arch. Entwicklungsmech. Organismen. 1915;41:159–214.
-
- Drasdo D, Kree R, McCaskill JS. Monte Carlo approach to tissue-cell populations. Phys Rev E Stat Phys Plasmas Fluids Relat Interdiscip Topics. 1995;52:6635–6657. - PubMed
Publication types
MeSH terms
Grants and funding
LinkOut - more resources
Full Text Sources
Other Literature Sources
Research Materials
Miscellaneous

