

Better models by discarding data?
- PMID: 23793147
- PMCID: PMC3689524
- DOI: 10.1107/S0907444913001121
Better models by discarding data?
Abstract
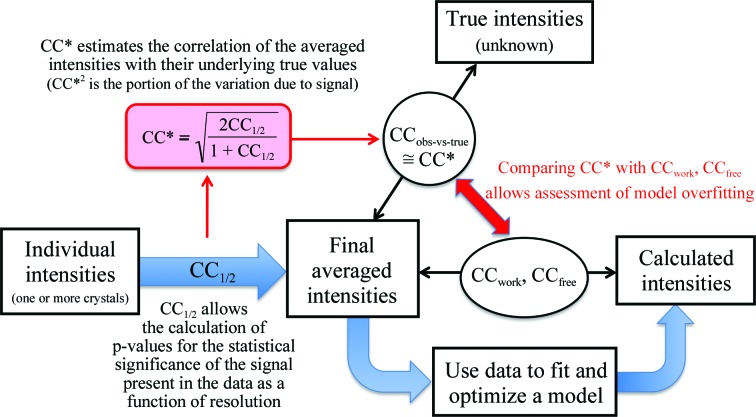
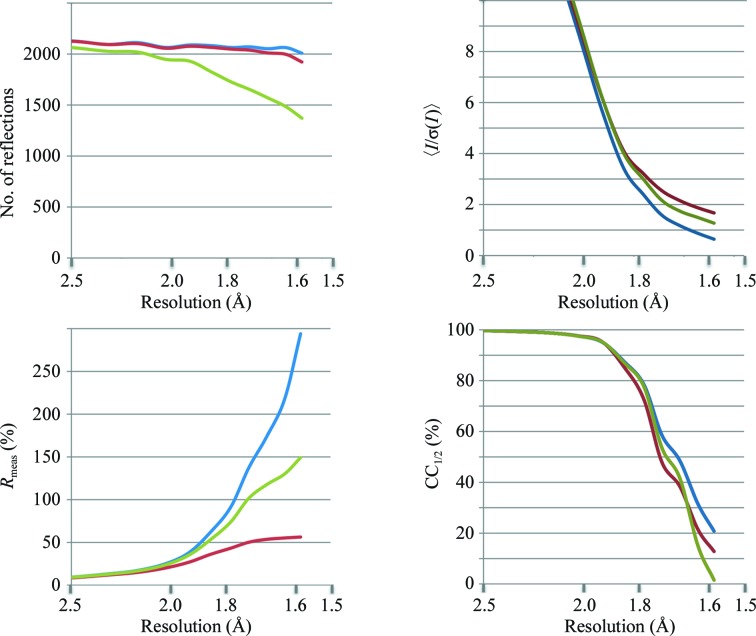
In macromolecular X-ray crystallography, typical data sets have substantial multiplicity. This can be used to calculate the consistency of repeated measurements and thereby assess data quality. Recently, the properties of a correlation coefficient, CC1/2, that can be used for this purpose were characterized and it was shown that CC1/2 has superior properties compared with `merging' R values. A derived quantity, CC*, links data and model quality. Using experimental data sets, the behaviour of CC1/2 and the more conventional indicators were compared in two situations of practical importance: merging data sets from different crystals and selectively rejecting weak observations or (merged) unique reflections from a data set. In these situations controlled `paired-refinement' tests show that even though discarding the weaker data leads to improvements in the merging R values, the refined models based on these data are of lower quality. These results show the folly of such data-filtering practices aimed at improving the merging R values. Interestingly, in all of these tests CC1/2 is the one data-quality indicator for which the behaviour accurately reflects which of the alternative data-handling strategies results in the best-quality refined model. Its properties in the presence of systematic error are documented and discussed.
Keywords: R value; correlation coefficient; data quality; model quality; outlier rejection.
Figures

Similar articles
-
Linking crystallographic model and data quality.Science. 2012 May 25;336(6084):1030-3. doi: 10.1126/science.1218231. Science. 2012. PMID: 22628654 Free PMC article.
-
On the relationship between cumulative correlation coefficients and the quality of crystallographic data sets.Protein Sci. 2017 Dec;26(12):2410-2416. doi: 10.1002/pro.3314. Epub 2017 Oct 27. Protein Sci. 2017. PMID: 28960580 Free PMC article.
-
Assessing and maximizing data quality in macromolecular crystallography.Curr Opin Struct Biol. 2015 Oct;34:60-8. doi: 10.1016/j.sbi.2015.07.003. Epub 2015 Jul 24. Curr Opin Struct Biol. 2015. PMID: 26209821 Free PMC article. Review.
-
Improved R-factors for diffraction data analysis in macromolecular crystallography.Nat Struct Biol. 1997 Apr;4(4):269-75. doi: 10.1038/nsb0497-269. Nat Struct Biol. 1997. PMID: 9095194
-
Collection of X-Ray Diffraction Data from Macromolecular Crystals.Methods Mol Biol. 2017;1607:165-184. doi: 10.1007/978-1-4939-7000-1_7. Methods Mol Biol. 2017. PMID: 28573573 Free PMC article. Review.
Cited by
-
Estimation of the quality of refined protein crystal structures.Protein Sci. 2015 May;24(5):661-9. doi: 10.1002/pro.2639. Epub 2015 Mar 11. Protein Sci. 2015. PMID: 25581292 Free PMC article.
-
Error estimates in atom coordinates and B factors in macromolecular crystallography.Curr Res Struct Biol. 2023 Nov 15;6:100111. doi: 10.1016/j.crstbi.2023.100111. eCollection 2023. Curr Res Struct Biol. 2023. PMID: 38058355 Free PMC article. Review.
-
Crystal structure of dopamine receptor D4 bound to the subtype selective ligand, L745870.Elife. 2019 Nov 21;8:e48822. doi: 10.7554/eLife.48822. Elife. 2019. PMID: 31750832 Free PMC article.
-
Improving the accuracy and resolution of neutron crystallographic data by three-dimensional profile fitting of Bragg peaks in reciprocal space.Acta Crystallogr D Struct Biol. 2018 Nov 1;74(Pt 11):1085-1095. doi: 10.1107/S2059798318013347. Epub 2018 Oct 29. Acta Crystallogr D Struct Biol. 2018. PMID: 30387767 Free PMC article.
-
Development of covalent chemogenetic K2P channel activators.bioRxiv [Preprint]. 2023 Oct 18:2023.10.15.561774. doi: 10.1101/2023.10.15.561774. bioRxiv. 2023. Update in: Cell Chem Biol. 2024 Jul 18;31(7):1305-1323.e9. doi: 10.1016/j.chembiol.2024.06.006. PMID: 37905049 Free PMC article. Updated. Preprint.
References
-
- Adams, P. D. et al. (2010). Acta Cryst. D66, 213–221. - PubMed
-
- Arndt, U. W., Crowther, R. A. & Mallett, J. F. W. (1968). J. Phys. E Sci. Instrum. 1, 510–516. - PubMed
-
- Diederichs, K. & Karplus, P. A. (1997). Nature Struct. Biol. 4, 269–275. - PubMed
-
- Diederichs, K. & Karplus, P. A. (2013). In Advancing Methods for Biomolecular Crystallography, edited by R. Read, A. G. Urzhumtsev & V. Y. Lunin. New York: Springer-Verlag.
MeSH terms
Substances
Grants and funding
LinkOut - more resources
Full Text Sources
Other Literature Sources
